Hi sindhu,
Follow below steps:
1. Plot a pie chart for profit and put category in color shelf.

2. Now create a calculative field as min 1 whose value is 1.
3. Add the field in row shelf twice and convert it to ATTR(min1).
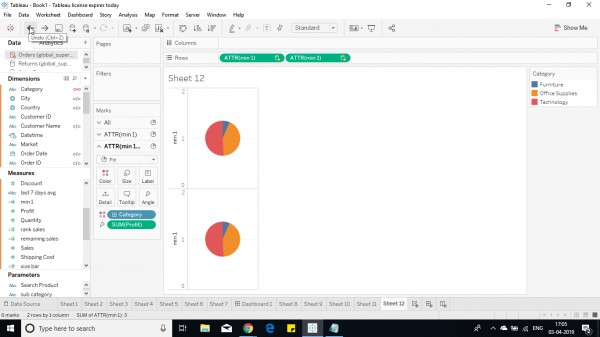
4. Now change the SUM([Profit] To [Sales] in the ATTR(min1)(2) .

5. So now you have 2 pie charts ready. Increase the size of 1st ATTR(min1) table.
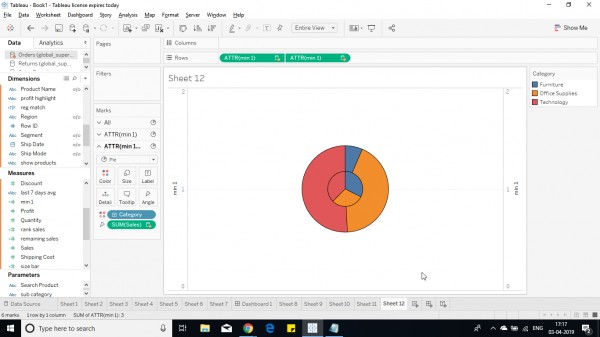
6. Now make a dual axis chart.
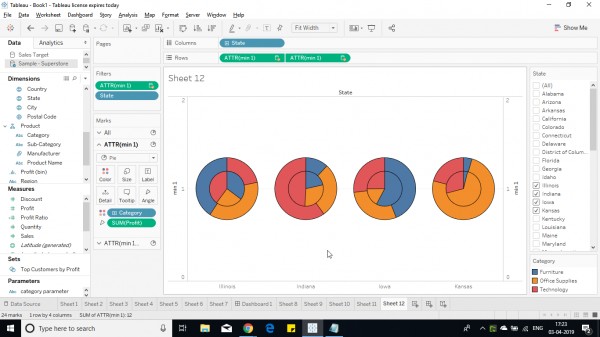
7. Add state over column shelf. Put state under filter and then add states.
Warning: You cannot compare more than 4 states at a time, else the visual is disturbed.
Hope it helps you.
 REGISTER FOR FREE WEBINAR
X
 Thank you for registering
Join Edureka Meetup community for 100+ Free Webinars each month
JOIN MEETUP GROUP