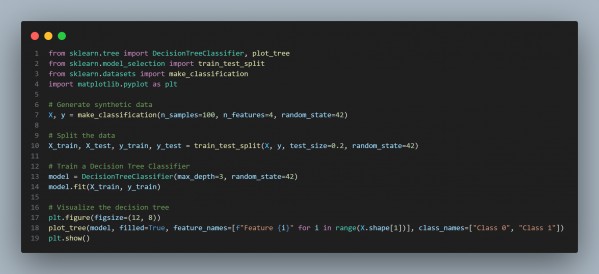
You can train a DecisionTreeClassifier and visualize the tree using Scikit-learn’s plot_tree to interpret model decisions.
Here is the code snippet you can refer to:
In the above code we are using the following key points:
- DecisionTreeClassifier(max_depth=3) limits tree depth to improve interpretability.
- plot_tree() creates a visual representation of decision splits, showing feature names and class labels.
- filled=True colorizes nodes based on class, improving readability.
- feature_names and class_names add context to the tree structure.
Hence, visualizing decision trees helps understand feature importance and decision paths, making models more transparent and interpretable.
 REGISTER FOR FREE WEBINAR
X
 Thank you for registering
Join Edureka Meetup community for 100+ Free Webinars each month
JOIN MEETUP GROUP