To debug memory leak issues in large-scale neural network models, you can follow the following:
- Monitor GPU/CPU Memory Usage: Use tools like Nvidia-smi for GPUs or memory profiling tools for CPUs.
- Check Data Loaders: Ensure proper batching and avoid in-memory data duplication.
- Track Tensor Creation: Verify that unnecessary tensors are not retained in memory.
- Use Profilers: Utilize TensorFlow/Keras or PyTorch profilers to analyze memory allocation.
- Release Unused Variables: Use del and garbage collection to release memory manually if required.
Here is the code snippet you can refer to:
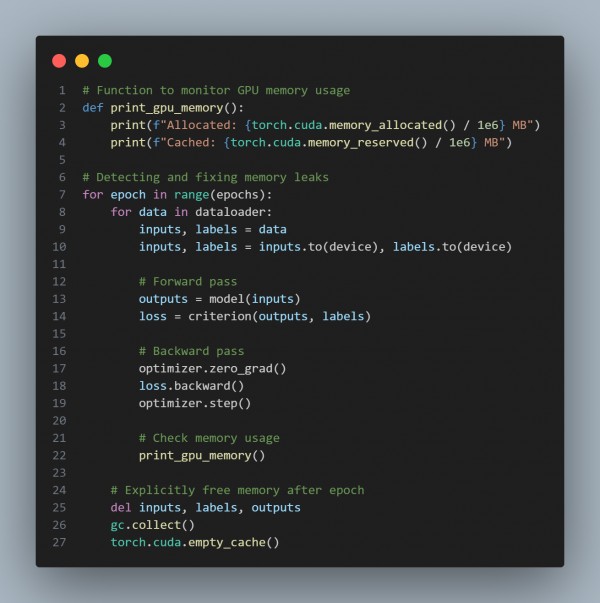
In the above code, we are using the following key points:
- Monitor Memory: Use tools like Nvidia-semi and profilers to track memory usage.
- Optimize Data Loading: Avoid in-memory duplications and use efficient batching.
- Clear Unused Tensors: Use del, gc.collect(), and clear caches as needed.
- Use Profilers: Leverage framework-specific profilers to identify memory bottlenecks.
- Optimize Model & Batch Size: Simplify architecture or use gradient accumulation for large batches.
Hence, these steps help identify and fix memory leaks effectively.
Related Post: How to optimize memory usage when deploying large generative models in production


