Draw boxplot with notch in R

0 votes

Hi Team,

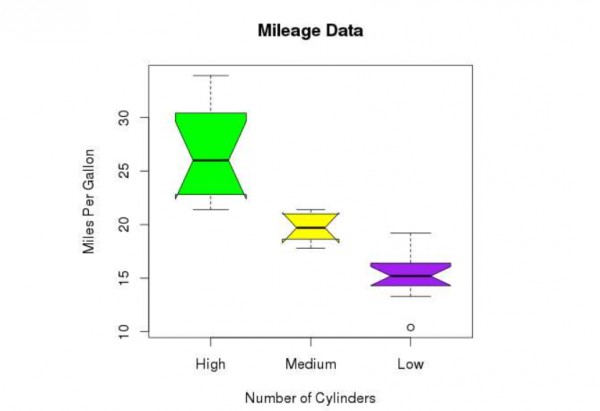
I have created a boxplot in R. I want to draw a boxplot with the notch to find out how the medians of different data groups match with each other. How can I do that?

Oct 30, 2020 in Data Analytics by akhtar
• 38,260 points
1,606 views

1 answer to this question.

0 votes

Hi@akhtar,

We can draw a boxplot with a notch to find out how the medians of different data groups. The below script will create a boxplot graph with the notch for each of the data groups.

png(file = "boxplot_with_notch.png"
boxplot(mpg ~ cyl, data = mtcars, 
   xlab = "Number of Cylinders",
   ylab = "Miles Per Gallon", 
   main = "Mileage Data",
   notch = TRUE, 
   varwidth = TRUE, 
   col = c("green","yellow","purple"),
   names = c("High","Medium","Low")
answered Oct 30, 2020 by MD
• 95,460 points

Related Questions In Data Analytics

0 votes
1 answer

How to plot side-by-side Plots with ggplot2 in R?

By Using gridExtra library we can easily ...READ MORE

answered Apr 16, 2018 in Data Analytics by DeepCoder786
• 1,720 points

edited Jun 9, 2020 by MD 8,845 views
0 votes
1 answer

How to print new lines with print() in R?

You can use cat() instead of writeLines(): ...READ MORE

answered May 3, 2018 in Data Analytics by kappa3010
• 2,090 points
880 views
0 votes
1 answer

How to filter a data frame with dplyr and tidy evaluation in R?

Requires the use of map_df to run each model, ...READ MORE

answered May 17, 2018 in Data Analytics by DataKing99
• 8,250 points
1,903 views
0 votes
1 answer

How to write a custom function which will replace all the missing values in a vector with the mean of values in R?

Consider this vector: a<-c(1,2,3,NA,4,5,NA,NA) Write the function to impute ...READ MORE

answered Jul 4, 2018 in Data Analytics by CodingByHeart77
• 3,750 points
4,559 views
+10 votes
3 answers

Which is a better initiative to learn data science: Python or R?

Well it truly depends on your requirement, If ...READ MORE

answered Aug 9, 2018 in Data Analytics by Abhi
• 3,720 points
1,634 views
+1 vote
1 answer
0 votes
1 answer
0 votes
1 answer

How to create the Boxplot in R?

Hi@akhtar, Boxplots are a measure of how well ...READ MORE

answered Oct 30, 2020 in Data Analytics by MD
• 95,460 points
699 views
+1 vote
3 answers

Filtering R data-frame with multiple conditions

You can use the 'filter' function from ...READ MORE

answered Mar 26, 2018 in Data Analytics by Bharani
• 4,660 points
87,157 views
webinar REGISTER FOR FREE WEBINAR X
REGISTER NOW
webinar_success Thank you for registering Join Edureka Meetup community for 100+ Free Webinars each month JOIN MEETUP GROUP