How to create the Boxplot in R

0 votes

Hi Team,

I have one dataset to visualize. I want to create a boxplot in R. How can I do that?

Oct 30, 2020 in Data Analytics by akhtar
• 38,260 points
694 views

1 answer to this question.

0 votes

Hi@akhtar,

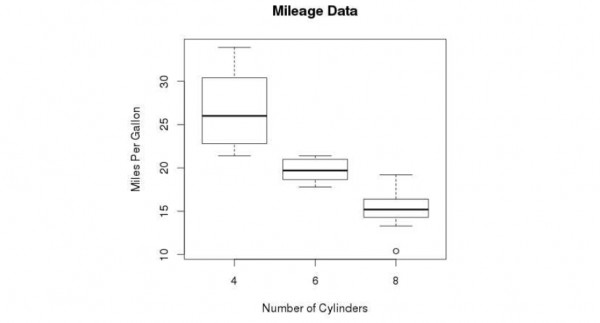
Boxplots are a measure of how well distributed is the data in a data set. It divides the data set into three quartiles. The below script will create a boxplot graph for the relation between mpg (miles per gallon) and cyl (number of cylinders).

png(file = "boxplot.png")
boxplot(mpg ~ cyl, data = mtcars, xlab = "Number of Cylinders", ylab = "Miles Per Gallon", main = "Mileage Data")
answered Oct 30, 2020 by MD
• 95,460 points

Related Questions In Data Analytics

0 votes
1 answer

How to create excellent examples in R?

An excellent example must consist of the ...READ MORE

answered Apr 10, 2018 in Data Analytics by kappa3010
• 2,090 points

edited Apr 12, 2018 by kappa3010 759 views
0 votes
1 answer

How to find out the sum/mean for multiple variables per group in R?

You can use the reshape2 package for ...READ MORE

answered Apr 12, 2018 in Data Analytics by DataKing99
• 8,250 points
3,824 views
0 votes
1 answer

How to create dummy variables based on a categorical variable of lists in R?

You can use mtabulate in the following way: library(qdapTools) cbind(data[1], ...READ MORE

answered Apr 13, 2018 in Data Analytics by CodingByHeart77
• 3,750 points
2,623 views
0 votes
1 answer

How to find out the package version which is loaded in R?

You can use sessionInfo() to accomplish that. > ...READ MORE

answered Apr 18, 2018 in Data Analytics by zombie
• 3,790 points
776 views
+10 votes
3 answers

Which is a better initiative to learn data science: Python or R?

Well it truly depends on your requirement, If ...READ MORE

answered Aug 9, 2018 in Data Analytics by Abhi
• 3,720 points
1,625 views
+1 vote
1 answer

Error saying "vector size cannot be NA" when using R with data mining

You can use the removesparseterm function.  Removes sparse ...READ MORE

answered Nov 15, 2018 in Data Analytics by Maverick
• 10,840 points
4,830 views
+1 vote
2 answers
0 votes
1 answer

Trying to find frequent itemsets of a data set using arules package

Try replacing ID <- c("A123","A123","A123","A123","B456","B456","B456") item <- c("bread", "butter", "milk", ...READ MORE

answered Nov 15, 2018 in Data Analytics by Maverick
• 10,840 points
810 views
0 votes
1 answer

How to create the Scatterplot in R?

Hi@akhtar, Scatterplots show many points plotted in the ...READ MORE

answered Oct 30, 2020 in Data Analytics by MD
• 95,460 points
658 views
+2 votes
2 answers

How to create our own dataframe in R?

Data frames are tabular data objects. Unlike ...READ MORE

answered Oct 29, 2020 in Data Analytics by anonymous
1,364 views
webinar REGISTER FOR FREE WEBINAR X
REGISTER NOW
webinar_success Thank you for registering Join Edureka Meetup community for 100+ Free Webinars each month JOIN MEETUP GROUP