Hi @Veronicabello,
Follow the below steps:
1. Create a group with the elements that you need in the stacked column.
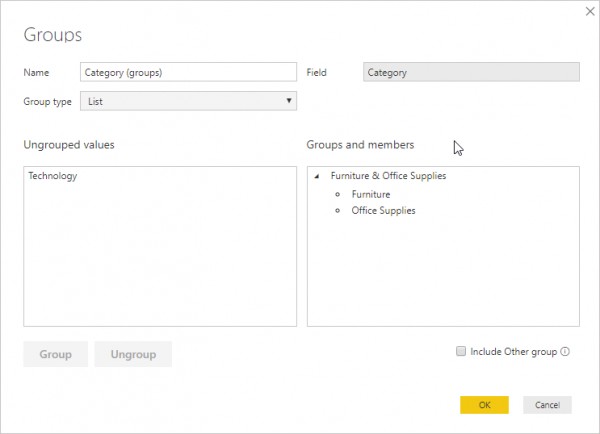
Right-click on the column and click New Group.

Select the values in field and click on Group. Click ok.
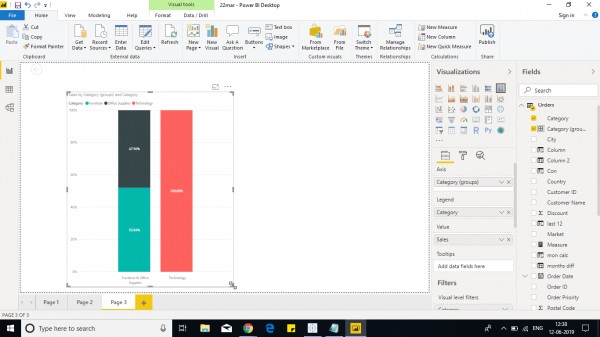
2. Place the created group column in Axis and measure or aggregated column in Values.
3. Drop the column in legend and select vertically stacked column chart.
You can see a stacked column and other individual columns.
Example-

Hope it helps!.
Know more about Stacked bar and line chart -Tableau
Ready to elevate your data skills? Dive into our Power BI Course Details and embark on a transformative learning journey designed for data enthusiasts, analysts, and business intelligence professionals!
 REGISTER FOR FREE WEBINAR
X
 Thank you for registering
Join Edureka Meetup community for 100+ Free Webinars each month
JOIN MEETUP GROUP