Hi Anitha, it's an easy procedure.
Follow the below steps:
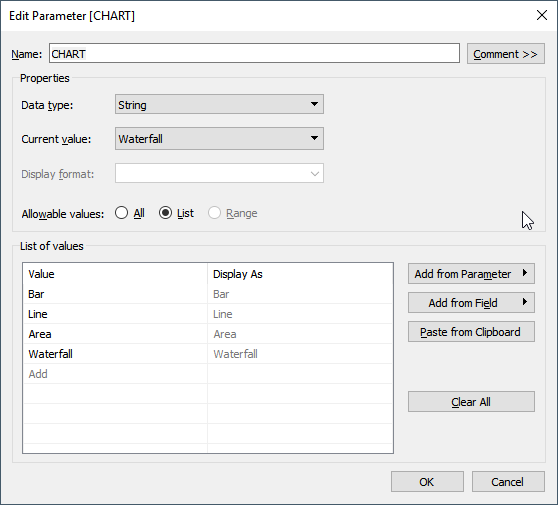
1. Create a parameter to choose the type of chart.
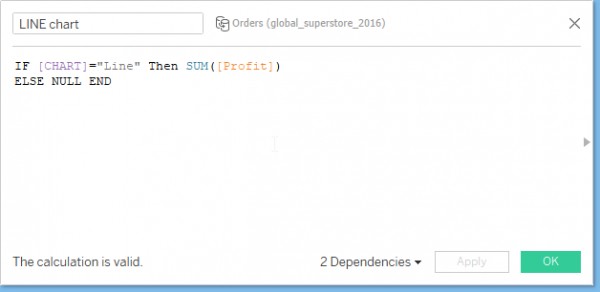
2. Now create a calculated field and use the field as below for each differing from the chart name.
IF [CHART]="Bar" Then SUM([Profit])
ELSE NULL END
3. Now place the created chart fields in the shelf.
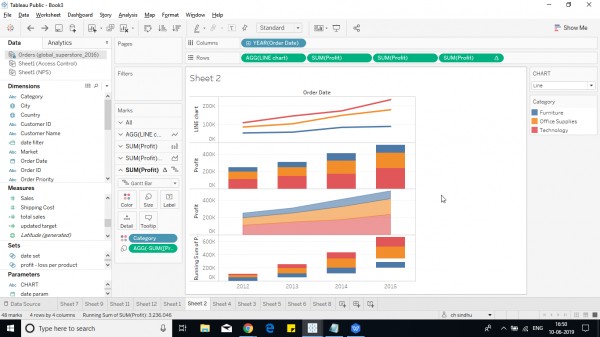
4. Create a dual axis graph with the fields that are created and clear all lines and headers
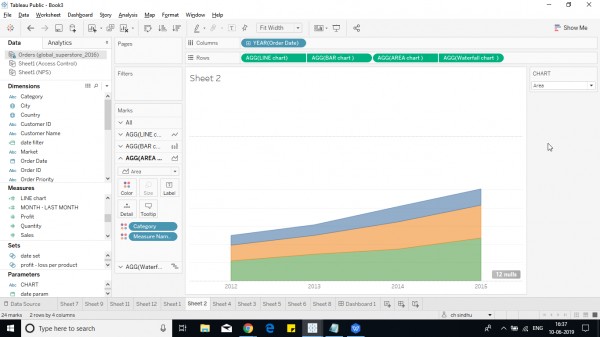
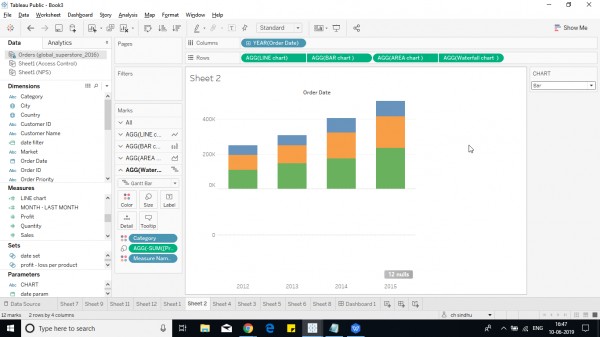
You can now change your visual using parameter.
Hope it helps!
 REGISTER FOR FREE WEBINAR
X
 Thank you for registering
Join Edureka Meetup community for 100+ Free Webinars each month
JOIN MEETUP GROUP