Hi Anitha,
It is easy and simple. Follow the below steps:
1. Create 2 Calculative fields to categorize the orders into positive and negative profits.
IF [PROFIT]>0 THEN [ORDER_ID] END similarly with -profit group
2. Now drop the two fields in the row self and select aggregation as count.
3. Drop the date in col shelf, you can either use a parameter or filter to filter days for a month. I used a filter to show day profits for a month for a year.
4. Now Double click on the field with - profit group and enter a - symbol in front of count function.
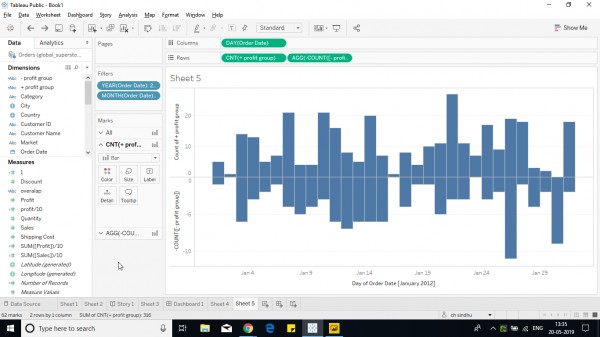
5. Now you would get a bar graph like this.

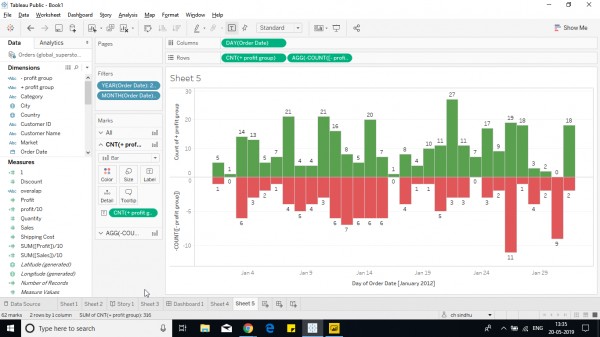
6. Edit the bar color and add labels.

Hope it helps you.
 REGISTER FOR FREE WEBINAR
X
 Thank you for registering
Join Edureka Meetup community for 100+ Free Webinars each month
JOIN MEETUP GROUP