Hi, Amrita
Follow the below steps:
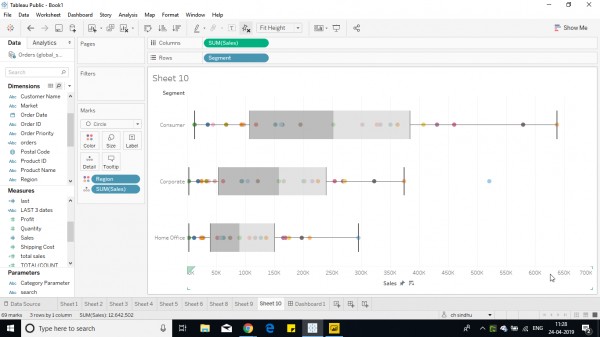
1. Create a whisker box plot using the required. (example below )

2. Now create a parameter or Filter to use the value to show as a reference line in a whisker box plot.
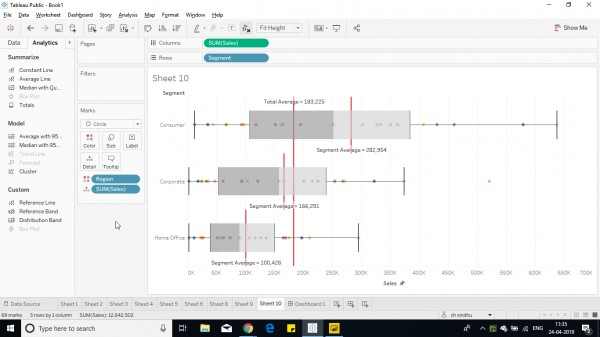
3. Now add an average line across table or cell.
4. Click on the line and click on edit if other aggregation required (Optional).
5. Now edit the value from value drop down.( select parameter to show parameter ) (for filter, the field value is automatically affected so select the same field).
Below example has average line for all segments indivisually as well each average.

6. Click ok.
Hope this helps you.
 REGISTER FOR FREE WEBINAR
X
 Thank you for registering
Join Edureka Meetup community for 100+ Free Webinars each month
JOIN MEETUP GROUP