Hi Anitha,
Its easy and simple, follow below steps:
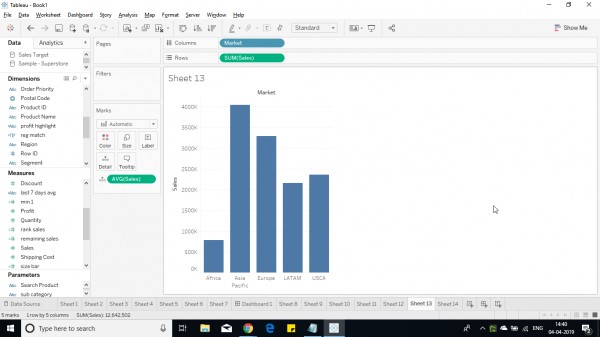
1. Create a bar chart as usual.

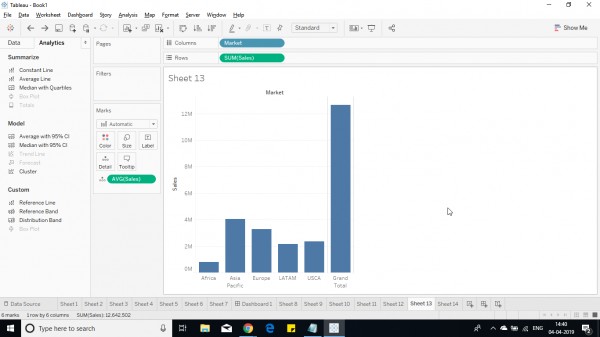
2. Add Grand totals from analytics pane.

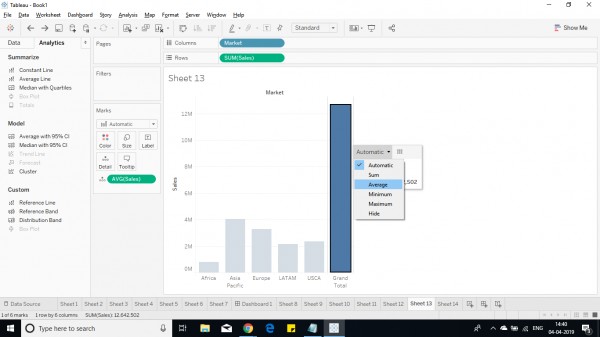
3. Now click on the grand total bar and click on automatic.
4. Select average in the drop down.

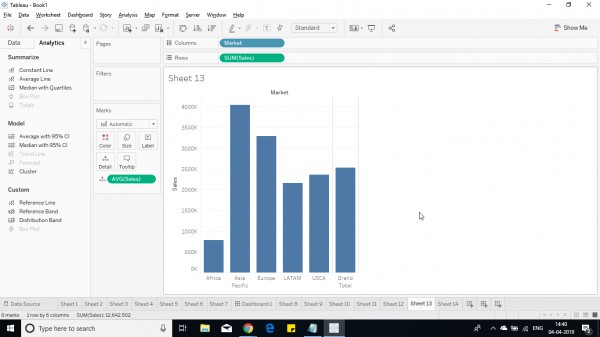
5. Now a average column for the chart of all values is shown at the last column.

6. Now edit the alias name for the column/bar to average or grand avg.
Hope this helps you.
 REGISTER FOR FREE WEBINAR
X
 Thank you for registering
Join Edureka Meetup community for 100+ Free Webinars each month
JOIN MEETUP GROUP