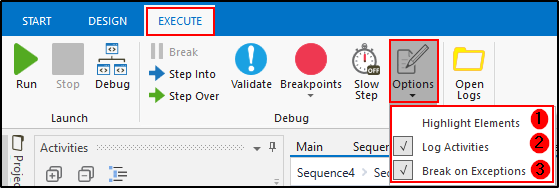
Hey Vikas, Options drop-down is present in Debug section of Execute ribbon. Debugging options allow you to focus on fragile parts in your workflow like highlighting UI elements during debugging, as well as logging all activities in the Output panel as they are debugged. There are 3 debugging options:
1. Highlight Elements: If enabled, UI elements are highlighted during debugging. The option can be used both with regular and step-by-step debugging.
2. Log Activities: If enabled, debugged activities are displayed as Trace logs in the Output panel. Please note that this option is enabled by default. Disabling Log Activities would generate smaller log files but by default, the debugger logs activities so that each step appears in the Output panel.
3. Break on Exceptions: The option is enabled by default and it triggers the Runtime Execution Error window, whenever an exception is detected during debugging. The execution stops and the activity which threw the error is highlighted. If the Break on Exceptions option is disabled, the Runtime Execution Error window is displayed, containing information on the thrown exception.

 REGISTER FOR FREE WEBINAR
X
 Thank you for registering
Join Edureka Meetup community for 100+ Free Webinars each month
JOIN MEETUP GROUP