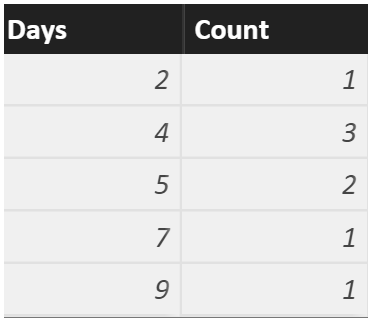
Suppose you've to obtain the Standard Deviation of the following data;
2,4,4,4,5,5,7,9
The mean(average) of the sample set = 5
First, you need to calculate the deviation of each element from the mean. (Basically, the squared difference of each element from the mean)

The mean of all deviations is the population variance. In this case, it is 4.

And the standard deviation is the square root of the population variance =2.
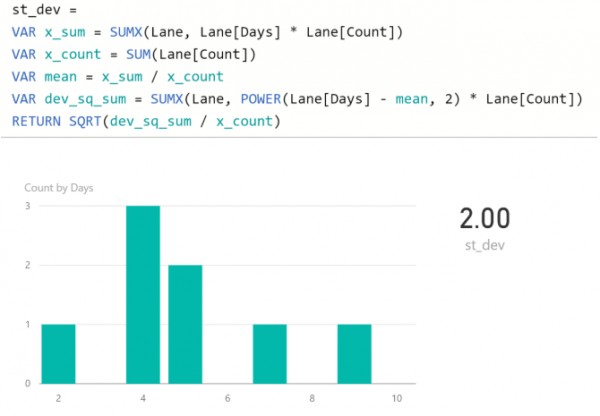
If you convert it into its Power BI equivalent,

And the measure is created as follows, the tricky part is to make use of the SUMX function. It's always convenient to break down the intermediate steps with VAR to make it more clear.

As a result, you get,

P.S. Power BI does have a built-in function for calculating standard deviation(e.g. STDEVX.P). However, it's not always useful. Do feel free to check it out though.
Ready to elevate your data skills? Dive into our Power BI Course Details and embark on a transformative learning journey designed for data enthusiasts, analysts, and business intelligence professionals!
 REGISTER FOR FREE WEBINAR
X
 Thank you for registering
Join Edureka Meetup community for 100+ Free Webinars each month
JOIN MEETUP GROUP