To use Grafana templating variables to switch between monitoring labels dynamically in real-time, you can follow the following steps:
- Define a Variable: Create a templating variable in Grafana (e.g., label_name) to represent the labels you want to monitor.
- Use Variable in Queries: Reference the variable in your dashboard queries to switch dynamically.
Here is the procedure you can refer to below:
-
Create a Variable:
- Navigate to Dashboard Settings > Variables > Add Variable.
- Set the variable type to Query, name it label_name, and use a query like:

- This retrieves all mode label values for node_cpu_seconds_total.
- Update your PromQL query to use the variable:
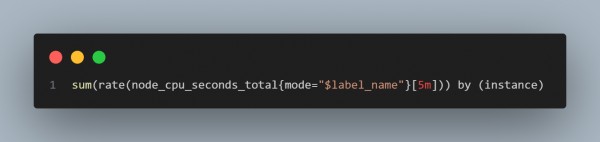
-
Use Variable in Panels:
- The $label_name will dynamically change based on the selected variable value.
- Test in Real-Time:
- Add the variable to the dashboard.
- Use the dropdown menu to switch between label values in real time and see the corresponding panel data update dynamically.
The above procedure provides benefits like:
- Real-Time Switching: Dynamically update queries without editing the dashboard.
- Reusability: Simplifies monitoring across multiple labels or dimensions.
- Customizations: Combine multiple variables for complex, interactive dashboards.
Hence, by referring to the above, you can use Grafana templating variables to switch between monitoring labels dynamically in real time


