Power BI Certification Training Course: PwC A ...
- 101k Enrolled Learners
- Weekend/Weekday
- Live Class
Tableau has emerged as one of the hottest trends in business intelligence in the last couple of years. This data visualization tool has been gaining popularity in companies as small as startups to the ones that drive the business. Hence, it’s pretty obvious that the average Tableau Developer Salary is skyrocketing.
A Tableau Developer’s average salary, as observed for the year 2019, is $111,431, but as I dug deeper, I realised there are multiple facets to this one story. So, in this article, I shall break down how this number varies across multiple factors such as geographies, skill sets and years of experience. Following are the topics to be covered in this article.
While we see annual salaries as high as $168,500 and as low as $53,000, the majority of Tableau Developer salaries currently range between $90,000 to $127,500 across the United States. The average pay range for a Tableau Developer varies little, which suggests that regardless of location, it is pretty uniform.
| Location (US) | Salary (in USD) |
| Charlotte, NC | 84,000 |
| New York, NY | 120,000 |
| San Jose, CA | 110,000 |
| Chicago, IL | 108,000 |
| Houston, TX | 80,000 |
The same cannot be said for India though. While other IT hubs like Chennai, Hyderabad and Bangalore maintain their 8-point-something lpa average, New Delhi seems to have attracted better paymasters as it has an average of 12lpa to offer to Tableau Developers.
| Location (India) | Salary (in INR) |
| Bangalore | 8,00,000 |
| Chennai | 8,20,000 |
| Gurgaon | 7,00,000 |
| New Delhi | 12,00,000 |
| Hyderabad | 7,80,000 |
The average Tableau Developer salary in USA is nearly $55 per hour. While most of the entry-level positions start at $58,300 per annum while most experienced workers can assume even up to $177,450 per annum.
Candidates in the 3-4 year experience bracket can expect the average $111K salary bracket, which isn’t a bad number at all!
If you take a quick look at the current job openings, it reveals that more than just a few top companies are looking for Tableau Developers.
| Companies Hiring | Job Openings per Day per Branch |
| EY | 120 |
| CapGemini | 93 |
| JP Morgan & Co. | 80 |
| Accenture | 55 |
| Wells Fargo | 29 |
| PepsiCo | 29 |
| Vodafone | 23 |
| Citi Bank | 22 |
| Deloitte | 29 |
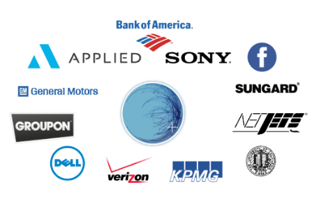
These brilliant pay-masters include but are not limited to Facebook, Dell, Applied Systems, Booz Allen Hamilton, NetJets, University of California, Groupon, General Motors, Sony Electronics, Sunguard, Bank of America, KPMG and Verizon. 
Hence, if you aspire to work for the big names in the industry, a career in Tableau is the way towards it.
Tableau developers should have an aptitude for data interpretation, are analytical in their approach to tasks, and have strong business acumen. Typically, employers will require a bachelor’s degree in Computer Science or Information Technology, or any alternative of the same, as well as the abilities that follow.
Analytical Skills – Tableau developers need to have a knack for recognising patterns and trends in numbers generated by the market.
Problem-Solving Skills – This role often involves working with the Tableau software from the beginning of a project until its completion, so candidates need to be able to solve any problems that arise during the development stage and find alternative ways around issues
Innovation – Creative and innovative solutions to business problems are definitely the need of the hour. Tableau developers need to take the initiative to find solutions and improvements to systems during prototyping and customer testing phases
Detail-Oriented – This job requires utmost attention to detail to spot inaccuracies in the code or data.
Teamwork – The developers work as part of a large team on a daily basis towards shared business and department goals, so the capability to work professionally with others is vital to being successful in this job.
In addition to general computer applications, Tableau developers also need hands-on experience with the tools of the trade such;
Contemporary Business Intelligence Technologies such as Microsoft Power BI, Oracle BI
Sql Server Data Tools like SQL Server Reporting Services (SSRS), SQL Server Analytics Services (SSAS) and SQL Server Integration Services (SSIS)
Data Analysis Tools like Online analytical processing (OLAP)
ETL Tools like Talend and Informatica
Scope for Tableau Developers
Tableau has been named as a Market Leader by Gartner Research in data visualization and business intelligence 7 times in a row, despite it’s slip to a close second in the February of 2019. It’s still the market leader when it comes down to its ability to execute and completeness of vision, compared to its market competition. If you take a look at google trends, it seems like this is a wonderful time to get certified in Tableau with Tableau Training and build a career in Business Intelligence and Data Analytics.
It just goes on to show that the future of Tableau is very bright and secure and there can be no better time than right now to jump into this bandwagon.
 Thank you for registering Join Edureka Meetup community for 100+ Free Webinars each month JOIN MEETUP GROUP
edureka.co
