Microsoft Azure Data Engineering Training Cou ...
- 15k Enrolled Learners
- Weekend
- Live Class
Python and Apache Spark are the hottest buzzwords in the analytics industry. Apache Spark is a popular open source framework that ensures data processing with lightning speed and supports various languages like Scala, Python, Java, and R. It then boils down to your language preference and scope of work. Through this PySpark programming article, I would be talking about Spark with Python to demonstrate how Python leverages the functionalities of Apache Spark.
Before we embark on our journey of PySpark Programming, let me list down the topics that I will be covering in this article:
So, let get started with the first topic on our list, i.e., PySpark Programming.
PySpark is the collaboration of Apache Spark and Python.
Apache Spark is an open-source cluster-computing framework, built around speed, ease of use, and streaming analytics whereas Python is a general-purpose, high-level programming language. It provides a wide range of libraries and is majorly used for Machine Learning and Real-Time Streaming Analytics.
In other words, it is a Python API for Spark that lets you harness the simplicity of Python and the power of Apache Spark in order to tame Big Data. Learn more about Big Data and its applications from the Azure Data Engineer Associate.
You might be wondering, why I chose Python to work with Spark when there are other languages available. To answer this, I have listed down few of the advantages that you will enjoy with Python:
Now that you know the advantages of PySpark programming, let’s simply dive into the fundamentals of PySpark.
This video will give you insights of the fundamental concepts of PySpark
RDDs are the building blocks of any Spark application. RDDs Stands for:
It is a layer of abstracted data over the distributed collection. It is immutable in nature and follows lazy transformations.
With RDDs, you can perform two types of operations:
Dataframe in PySpark is the distributed collection of structured or semi-structured data. This data in Dataframe is stored in rows under named columns which is similar to the relational database tables or excel sheets.
It also shares some common attributes with RDD like Immutable in nature, follows lazy evaluations and is distributed in nature. It supports a wide range of formats like JSON, CSV, TXT and many more. Also, you can load it from the existing RDDs or by programmatically specifying the schema.
PySpark SQL is a higher-level abstraction module over the PySpark Core. It is majorly used for processing structured and semi-structured datasets. It also provides an optimized API that can read the data from the various data source containing different files formats. Thus, with PySpark you can process the data by making use of SQL as well as HiveQL. Because of this feature, PySpark SQL is slowly gaining popularity among database programmers and Apache Hive users.
Subscribe to our YouTube channel to get new updates...
PySpark Streaming is a scalable, fault-tolerant system that follows the RDD batch paradigm. It is basically operated in mini-batches or batch intervals which can range from 500ms to larger interval windows.
In this, Spark Streaming receives a continuous input data stream from sources like Apache Flume, Kinesis, Kafka, TCP sockets etc. These streamed data are then internally broken down into multiple smaller batches based on the batch interval and forwarded to the Spark Engine. Spark Engine processes these data batches using complex algorithms expressed with high-level functions like map, reduce, join and window. Once the processing is done, the processed batches are then pushed out to databases, filesystems, and live dashboards.

The key abstraction for Spark Streaming is Discretized Stream (DStream). DStreams are built on RDDs facilitating the Spark developers to work within the same context of RDDs and batches to solve the streaming issues. Moreover, Spark Streaming also integrates with MLlib, SQL, DataFrames, and GraphX which widens your horizon of functionalities. Being a high-level API, Spark Streaming provides fault-tolerance “exactly-once” semantics for stateful operations.
NOTE: “exactly-once” semantics means events will be processed “exactly once” by all operators in the stream application, even if any failure occurs.
Below diagram, represents the basic components of Spark Streaming.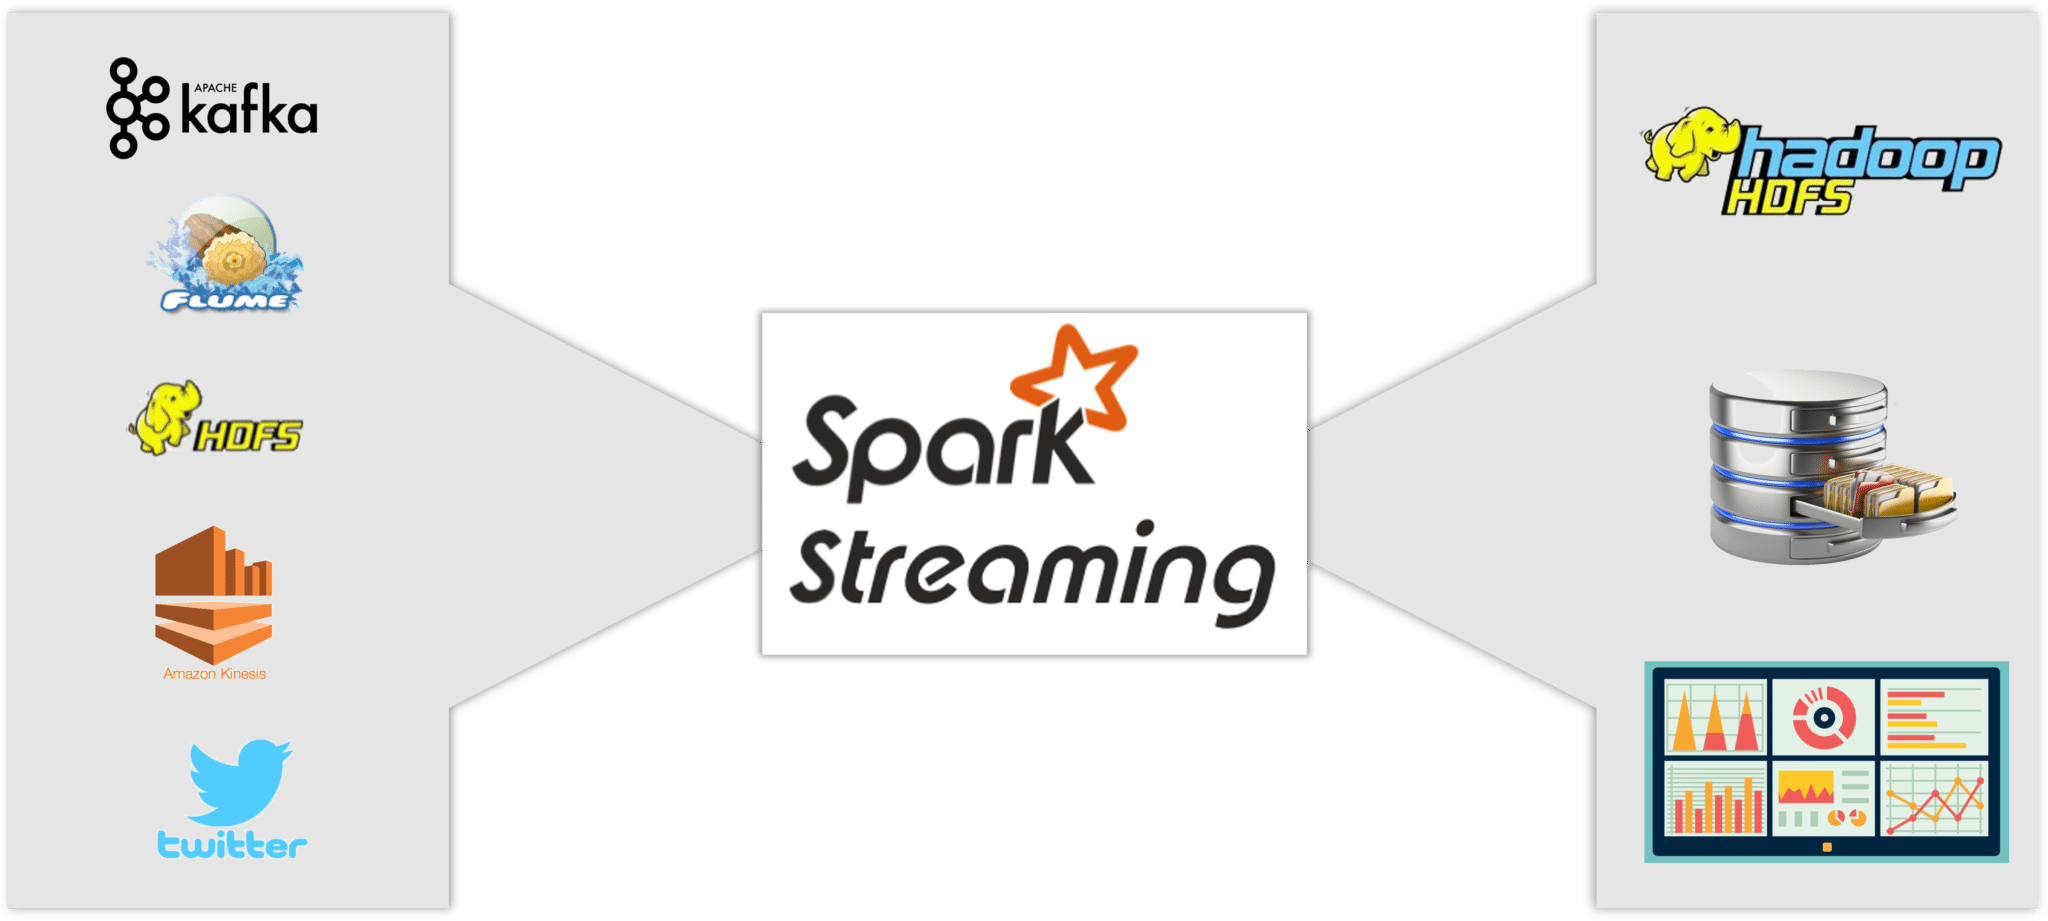
As you can see, Data is ingested into the Spark Stream from various sources like Kafka, Flume, Twitter, ZeroMQ, Kinesis, or TCP sockets, and many more. Further, this data is processed using complex algorithms expressed with high-level functions like map, reduce, join, and window. Finally, this processed data is pushed out to various file systems, databases, and live dashboards for further utilization.
I hope this gave you a clear picture of how PySpark Streaming works. Let’s now move on to the last but most enticing topic of this PySpark Programming article, i.e. Machine Learning.
Learn more about Big Data and its applications from the Azure Data Engineering Course in Mumbai.
As you already know, Python is a mature language that is being heavily used for data science and machine learning since ages. In PySpark, machine learning is facilitated by a Python library called MLlib (Machine Learning Library). It is nothing but a wrapper over PySpark Core that performs data analysis using machine-learning algorithms like classification, clustering, linear regression and few more.
One of the enticing features of machine learning with PySpark is that it works on distributed systems and is highly scalable.
MLlib exposes three core machine learning functionalities with PySpark:
Let me show you how to implement machine learning using classification through logistic regression.
Here, I will be performing a simple predictive analysis on a food inspection data of Chicago City.
##Importing the required libraries
from pyspark.ml import Pipeline
from pyspark.ml.classification import LogisticRegression
from pyspark.ml.feature import HashingTF, Tokenizer
from pyspark.sql import Row
from pyspark.sql.functions import UserDefinedFunction
from pyspark.sql.types import *

##creating a RDD by importing and parsing the input data
def csvParse(s):
import csv
from StringIO import StringIO
sio = StringIO(s)
value = csv.reader(sio).next()
sio.close()
return value

food_inspections = sc.textFile('file:////home/edureka/Downloads/Food_Inspections_Chicago_data.csv')
.map(csvParse)

##Display data format
food_inspections.take(1)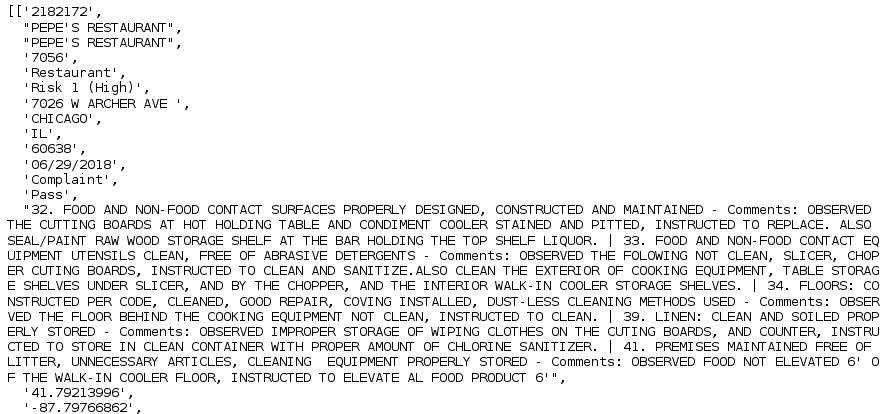
#Structuring the data
schema = StructType([
StructField("id", IntegerType(), False),
StructField("name", StringType(), False),
StructField("results", StringType(), False),
StructField("violations", StringType(), True)])
#creating a dataframe and a temporary table (Results) required for the predictive analysis.
##sqlContext is used to perform transformations on structured data
ins_df = spark.createDataFrame(food_inspections.map(lambda l: (int(l[0]), l[1], l[12], l[13])) , schema)
ins_df.registerTempTable('Count_Results')
ins_df.show()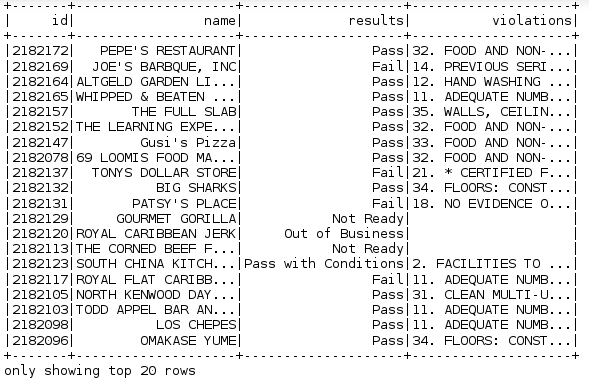
##Let's now understand our dataset
#show the distinct values in the results column
result_data = ins_df.select('results').distinct().show()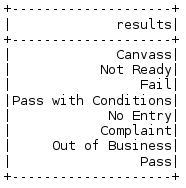
##converting the existing dataframe into a new dataframe
###each inspection is represented as a label-violations pair.
####Here 0.0 represents a failure, 1.0 represents a success, and -1.0 represents some results besides those two
def label_Results(s):
if s == 'Fail':
return 0.0
elif s == 'Pass with Conditions' or s == 'Pass':
return 1.0
else:
return -1.0
ins_label = UserDefinedFunction(label_Results, DoubleType())
labeled_Data = ins_df.select(ins_label(ins_df.results).alias('label'), ins_df.violations).where('label >= 0')
labeled_Data.take(1)
##Creating a logistic regression model from the input dataframe
tokenizer = Tokenizer(inputCol="violations", outputCol="words")
hashingTF = HashingTF(inputCol=tokenizer.getOutputCol(), outputCol="features")
lr = LogisticRegression(maxIter=10, regParam=0.01)
pipeline = Pipeline(stages=[tokenizer, hashingTF, lr])
model = pipeline.fit(labeled_Data)
## Evaluating with Test Data

test_Data = sc.textFile('file:////home/edureka/Downloads/Food_Inspections_test.csv')
.map(csvParse)
.map(lambda l: (int(l[0]), l[1], l[12], l[13]))
test_df = spark.createDataFrame(test_Data, schema).where("results = 'Fail' OR results = 'Pass' OR results = 'Pass with Conditions'")
predict_Df = model.transform(test_df)
predict_Df.registerTempTable('Predictions')
predict_Df.columns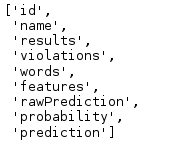
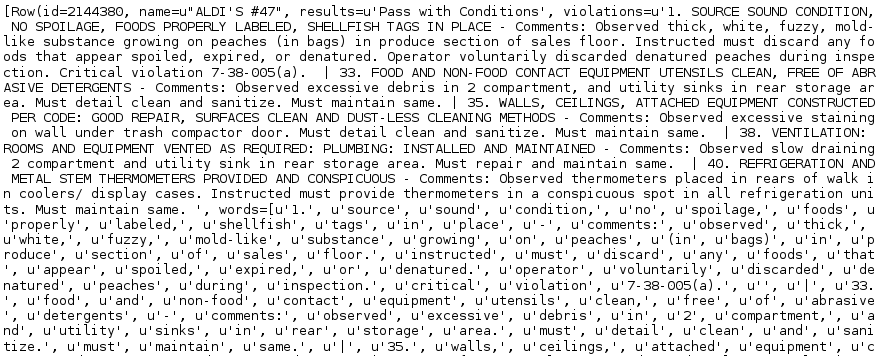
## Printing 1st row
predict_Df.take(1)
## Predicting the final result
numOfSuccess = predict_Df.where("""(prediction = 0 AND results = 'Fail') OR
(prediction = 1 AND (results = 'Pass' OR
results = 'Pass with Conditions'))""").count()
numOfInspections = predict_Df.count()
print "There were", numOfInspections, "inspections and there were", numOfSuccess, "successful predictions"
print "This is a", str((float(numOfSuccess) / float(numOfInspections)) * 100) + "%", "success rate"
![]()
With this, we come to the end of this blog on PySpark Programming. Hope it helped in adding some value to your knowledge.
 Thank you for registering Join Edureka Meetup community for 100+ Free Webinars each month JOIN MEETUP GROUP
edureka.co