Full Stack Development Internship Program
- 29k Enrolled Learners
- Weekend/Weekday
- Live Class
(11300)


 Copy Link!
In today’s data-driven landscape, organizations need robust solutions for managing, analyzing, and visualizing information. Microsoft offers two standout platforms that fulfill these needs, each addressing different stages of the data lifecycle. This blog breaks down how these tools complement and differ from one another to help you identify the best fit for your business.
One platform is designed primarily for business intelligence, offering intuitive ways to connect to various data sources, build interactive dashboards, and share insights. Its purpose is to simplify data exploration for users across skill levels.
The other is a more comprehensive environment that supports data integration, engineering, warehousing, and real-time analytics — all in one unified experience. It enables data professionals to collaborate, process, and analyze large volumes of information seamlessly, helping eliminate data silos and streamline workflows from ingestion to insight.
The Real-World Example: Retail Giant’s Data Journey will be examined next.
Take ShopSphere, a multinational retailer managing data from stores, online sales, feedback systems, and logistics. Their engineering team uses the broader platform to ingest, cleanse, and analyze real-time data from all sources. Once processed, insights flow into intuitive dashboards used by managers to track sales, inventory, and customer satisfaction. In this setup, the heavy lifting is handled by the analytics engine, while the BI tool brings insights to life through compelling visualizations.
This demonstrates the complementary nature of the two — one ensures data readiness, and the other delivers business-ready insights.
We’ll see later. Microsoft Fabric: What is it?
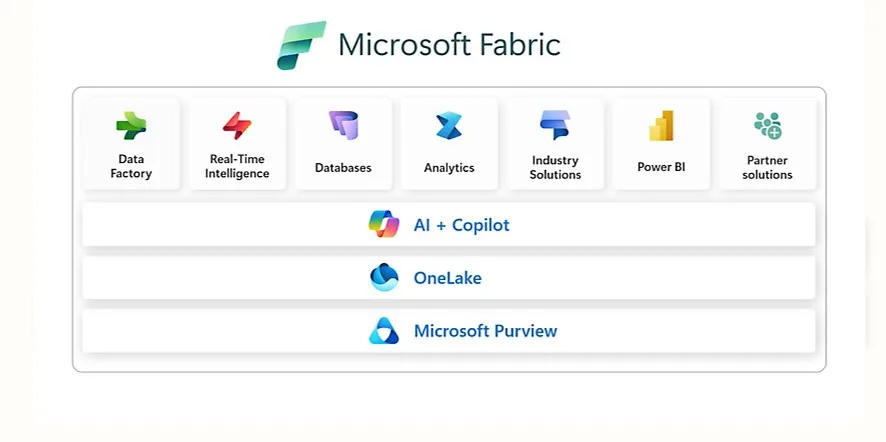
In the broader Microsoft ecosystem, Fabric is a unified data platform that blends data science, engineering, and management into one seamless experience. Unlike previous solutions, it forms the core of Microsoft’s modern data strategy—more than just a standalone tool.
Some of the platform’s standout features include:
End-to-end data management: It acts as a centralized hub for handling the entire data lifecycle—covering everything from ingestion to transformation and storage—ideal for organizations with complex needs.
Seamless Azure connectivity: Deep integration with the cloud allows for highly scalable processing and storage, leveraging the full power of Microsoft’s infrastructure.
All-in-one toolkit: It equips teams with a robust suite of tools for machine learning, advanced analytics, and engineering workflows, streamlining collaboration on sophisticated data initiatives.
Real-time processing: The ability to handle data as it arrives means quicker decision-making, fueled by the most up-to-date insights.
Built for collaboration: Designed with teamwork in mind, it breaks down silos and ensures insights flow across departments, helping everyone stay aligned.
 We’ll look at what Power BI is next.
Microsoft offers a leading solution for business intelligence (BI) and data visualization through this platform. It empowers users to build dynamic dashboards and reports, transforming raw data into actionable insights.
Due to its intuitive interface and robust feature set, this tool is widely adopted by organizations focused on BI and data-driven decision-making.
Key highlights include:
Advanced visualizations: A wide variety of chart types and visuals allow users to design interactive and insightful dashboards.
Broad data connectivity: Seamless integration with numerous data sources enables streamlined access and analysis across systems.
Interactive exploration: Users can build dashboards that support real-time interaction and deep data exploration.
AI-enhanced analytics: Built-in machine learning capabilities help uncover hidden patterns and trends within datasets.
Vibrant community: A strong global network provides extensive support, learning resources, and shared best practices for users at all levels.
Next, we’ll examine the key distinctions between Power BI and Microsoft Fabric.
Despite being integrated into Microsoft Fabric, the standalone version of this business intelligence solution remains available. Choosing the right tool depends on understanding their core distinctions.
The primary focus of the BI tool is on data visualization and reporting. In contrast, Microsoft Fabric serves as a comprehensive platform covering the entire data lifecycle—ranging from ingestion and storage to transformation, analysis, and visualization.
While Fabric includes visualization capabilities, it extends further to support data science, engineering, and real-time processing functionalities.
The visualization tool comes equipped with basic modeling and transformation features like Power Query, making it ideal for building reports and dashboards.
Fabric, however, takes a broader approach by offering advanced data engineering, warehousing, and scalable data operations, making it more suitable for complex and large-scale projects.
Fabric is deeply integrated with Azure tools such as Synapse, Data Factory, and OneLake. This allows seamless data movement and end-to-end workflows within the same environment. It also supports various sources, including cloud storage, on-prem databases, and third-party platforms, making it highly versatile for hybrid ecosystems.
Meanwhile, the visualization tool offers wide-ranging data connectors—from Azure SQL and SharePoint to Salesforce and Google Analytics—enabling quick access to structured and semi-structured data. However, it leans more toward transforming and presenting cleaned data rather than processing raw datasets.
One of the key advantages of the visualization platform is its intuitive, user-friendly interface. With features like drag-and-drop, dashboard creation, and filters, it’s ideal for business users with little to no coding experience. This simplicity contributes greatly to its global popularity.
Fabric, on the other hand, has a unified yet technically inclined interface. Designed for data engineers and developers, it features pipelines, lakehouses, notebooks, and SQL environments—requiring a stronger grasp of data architecture.
Fabric allows for extensive backend customization, including notebooks and tailored data pipelines. Its flexibility suits advanced users creating end-to-end data solutions.
Conversely, the reporting tool shines in front-end customization. Users can design visuals, implement DAX, bookmark pages, set up tooltips, and fine-tune filters—balancing power with accessibility.
The service version of the visualization tool supports publishing reports, scheduling refreshes, and sharing dashboards across teams. Integration with MS Teams and features like data lineage enhance collaborative efficiency.
Fabric also offers shared workspaces but on a broader scale—enabling data professionals from different domains to co-develop notebooks, dataflows, and pipelines in a unified space, reducing handoffs and improving team synergy.
Fabric’s AI features are robust, integrating with Azure ML and Spark-based notebooks. This makes it suitable for training, deploying, and operationalizing machine learning models directly within the platform.
In contrast, the visualization solution includes accessible AI capabilities for business users. These include natural language Q&A, smart visuals like key influencers, and automated narratives—focused more on insight generation than deep model development.
Microsoft Fabric is built for enterprise-wide deployments where governance, consistency, and automation are critical. It integrates multiple roles—data engineers, scientists, and analysts—within a single, scalable environment.
The visualization platform excels in self-service deployments, enabling departments and business units to explore and visualize data with minimal IT intervention. This makes it agile and business-user friendly, especially in decentralized environments.
After discussing the key differences between Microsoft Fabric and Power BI, we’ll examine how the two work together.
Although Microsoft Fabric and Microsoft’s data visualization platform have different roles, they complement each other perfectly. Fabric serves as a scalable back end for data management and processing, ensuring data is clean and transformed for analytics. Meanwhile, the visualization layer utilizes this processed data to create impactful reports and dashboards, helping stakeholders make informed decisions. With Fabric handling the ingestion and transformation pipeline, the front-end tool connects seamlessly to deliver insights effectively.
Next, we’ll see How can I switch to Fabric from Power BI?
If you’re already using the cloud-based reporting service, you now have access to Fabric and its extended capabilities. There’s no actual migration needed—your content remains intact. Workspaces, reports, and user experience all continue without disruption. The tool functions inside Fabric just as it did in its standalone version.
Start exploring the platform. Fabric will feel familiar if you’ve used Azure services like Data Factory or Data Explorer, which are now integrated into this unified SaaS environment.
Existing users will also recognize much of the interface and workflow. Fabric builds on the same foundation, sharing core elements like workspaces, reports, and capacities. Administrative functions for both are now accessible through the centralized Fabric admin center.
Next, we’ll see How does Power BI interact with Microsoft Fabric?
Workloads, roles, and data are unified in a single environment within Fabric. One key workload integrated into this ecosystem is data visualization and reporting. Each tenant is provided with a single data store called OneLake, allowing seamless access and analysis across all functionalities. OneLake’s centralized structure simplifies working with large, diverse data sets by enabling consistent usage and visualization across roles and tools—particularly beneficial for enterprises handling massive volumes of information.
Fabric also centralizes administrative control over reporting platforms. Despite this shift in governance, your familiar tools—such as Desktop and Service environments—continue to operate as before, allowing users to convert raw data from sources like Excel or OneLake into actionable insights with ease.
Later on, we’ll examine selecting the appropriate tool and the conclusion.
If your focus is on creating interactive dashboards and visual reports from existing data, a dedicated visualization platform is the better fit. It offers user-friendly features tailored for business professionals seeking quick insights without diving into complex data engineering.
On the other hand, opt for Fabric when you need a comprehensive solution to manage the entire data lifecycle—from ingestion and transformation to storage, analysis, and reporting. This unified approach is ideal for enterprises with complex data environments looking for an integrated, end-to-end analytics solution.
Fabric offers a comprehensive platform for end-to-end data analytics, business intelligence, and visual reporting. Understanding the unique strengths of each solution helps organizations make strategic choices and ensure their data initiatives align with business objectives. Used together, they deliver powerful capabilities that blend robust data management with insightful visualizations.
This Blog post explores the differences and synergy between the two. Fabric equips engineers and data scientists with a complete data stack and focuses on self-service analytics. Their integration creates a streamlined pipeline from raw data to actionable insights.
If you’re aiming to master Microsoft Fabric and Power BI for next-gen data roles, consider enrolling in Edureka’s Power BI Certification Training and Microsoft Fabric Data Engineer Associate (DP-700) course. These programs offer a comprehensive learning path—covering everything from data modeling to DAX data engineering and analytics pipelines in Fabric. With expert-led live sessions, real-world projects, and certification preparation for both PL-300 and DP-700 exams, these courses are designed to build practical, job-ready skills for business intelligence and modern data engineering careers.
Do you have any questions or need further information? Feel free to leave a comment below, and we’ll respond as soon as possible!
Related Posts: