Hi@akhtar,
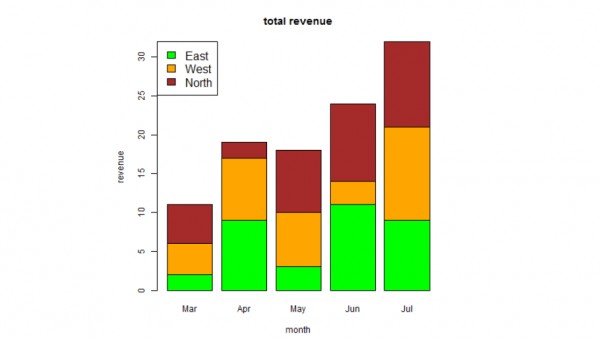
We can create a bar chart with groups of bars and stacks in each bar by using a matrix as input values. More than two variables are represented as a matrix which is used to create the group bar chart and stacked bar chart as shown below.
colors = c("green","orange","brown")
months <- c("Mar","Apr","May","Jun","Jul")
regions <- c("East","West","North")
Values <- matrix(c(2,9,3,11,9,4,8,7,3,12,5,2,8,10,11), nrow = 3, ncol = 5, byrow = TRUE)
png(file = "barchart_stacked.png")
barplot(Values, main = "total revenue", names.arg = months, xlab = "month", ylab = "revenue", col = colors)
legend("topleft", regions, cex = 1.3, fill = colors)

 REGISTER FOR FREE WEBINAR
X
 Thank you for registering
Join Edureka Meetup community for 100+ Free Webinars each month
JOIN MEETUP GROUP