Hi@akhtar,
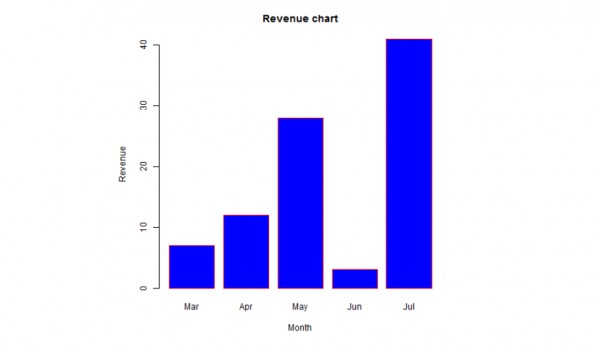
The features of the bar chart can be expanded by adding more parameters. The main parameter is used to add the title. You can see the below example.
# Create the data for the chart
H <- c(7,12,28,3,41)
M <- c("Mar","Apr","May","Jun","Jul")
# Give the chart file a name
png(file = "barchart_months_revenue.png")
# Plot the bar chart
barplot(H,names.arg=M,xlab="Month",ylab="Revenue",col="blue",
main="Revenue chart",border="red")

 REGISTER FOR FREE WEBINAR
X
 Thank you for registering
Join Edureka Meetup community for 100+ Free Webinars each month
JOIN MEETUP GROUP