K Means using elbow method

0 votes
How to use elbow method to find the best no of clusters to use K Means?
Aug 25, 2019 in Data Analytics by praneel
3,047 views

1 answer to this question.

0 votes

Elbow method allows the user to know the best fit number of clusters.

Follow the below steps:

  1. Compute clustering algorithm (e.g., k-means clustering) for different values of k. For instance, by varying k from 1 to 10 clusters.
  2. For each k, calculate the tot.withinss.
  3. Plot the curve of above values against the number of clusters from step 1.
  4. The value at the bend of the plot is considered as the best fit value for no of clusters.
totwss=sapply(1:10, function(k) { kmeans(mtcars$mpg,k)$tot.withinss})
k = data.frame(k = 1:6,totwss = totwss)
ggplot(k,aes(k,totwss))+geom_line()
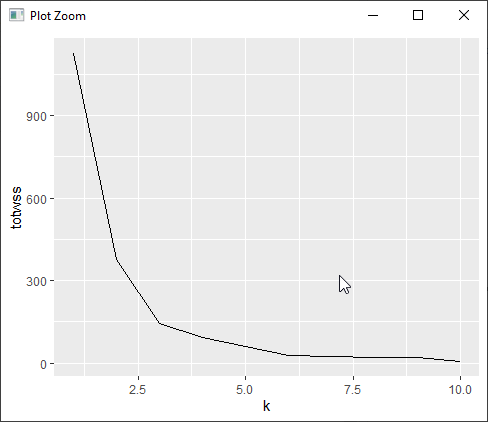
In this case, you can take 2 or 3 as per your choice.

answered Aug 26, 2019 by anonymous
• 33,030 points

Related Questions In Data Analytics

0 votes
1 answer

​can we do the feature extraction using K means clustering? If yes how can we do that?

Hi@Pushpender, You can do that. But K-Means is ...READ MORE

answered Nov 24, 2020 in Data Analytics by MD
• 95,460 points
736 views
+1 vote
1 answer

Join using two mappers - invalid inputfile exception

Dear Learner, Hope you are doing well. Can you ...READ MORE

answered Dec 18, 2017 in Data Analytics by Sudhir
• 1,570 points
636 views
0 votes
1 answer

Using "dplyr" to summarise multiple columns

You can use the "sumamrise_all()" function for ...READ MORE

answered Mar 27, 2018 in Data Analytics by Bharani
• 4,660 points
1,681 views
0 votes
1 answer

Left Join and Right Join using "dplyr"

The below is the code to perform ...READ MORE

answered Mar 27, 2018 in Data Analytics by Bharani
• 4,660 points
1,215 views
0 votes
1 answer

Use different distance formula other than euclidean distance in k means

K-means is based on variance minimization. The sum-of-variance formula ...READ MORE

answered Jun 21, 2018 in Data Analytics by Sahiti
• 6,370 points
1,688 views
+1 vote
1 answer

k means vs KNN

K-means clustering is basically an unsupervised clustering ...READ MORE

answered Oct 30, 2018 in Data Analytics by kurt_cobain
• 9,350 points
1,064 views
0 votes
1 answer

Big Data transformations with R

Dear Koushik, Hope you are doing great. You can ...READ MORE

answered Dec 18, 2017 in Data Analytics by Sudhir
• 1,570 points
1,113 views
0 votes
2 answers

Transforming a key/value string into distinct rows in R

We would start off by loading the ...READ MORE

answered Mar 26, 2018 in Data Analytics by Bharani
• 4,660 points
1,296 views
+1 vote
3 answers

How to change the value of a variable using R programming in a data frame?

Try this: df$symbol <- as.character(df$symbol) df$symbol[df$sym ...READ MORE

answered Jan 11, 2019 in Data Analytics by Tyrion anex
• 8,700 points
35,943 views
0 votes
1 answer

How to edit the labels and limit if a plot using ggplot? - R

Add a limit to axis ticks using ...READ MORE

answered Nov 3, 2019 in Data Analytics by anonymous
• 33,030 points
750 views
webinar REGISTER FOR FREE WEBINAR X
REGISTER NOW
webinar_success Thank you for registering Join Edureka Meetup community for 100+ Free Webinars each month JOIN MEETUP GROUP