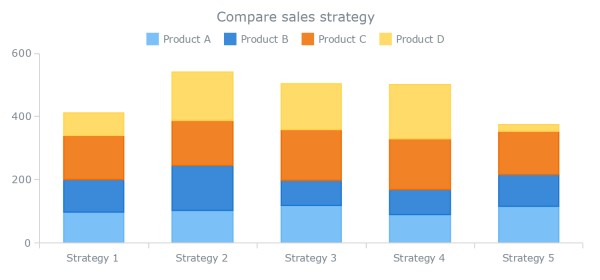
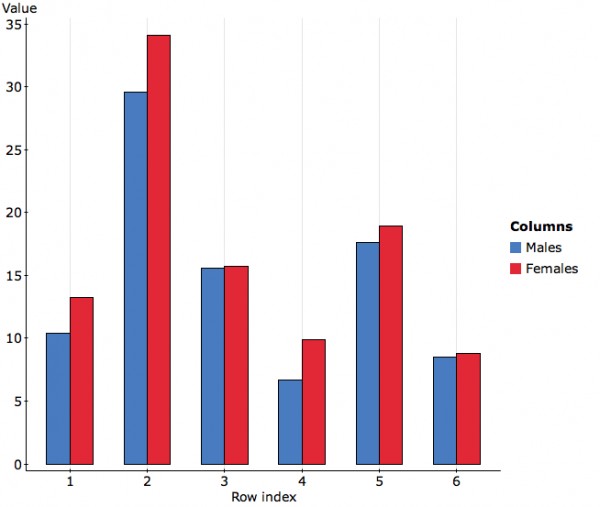
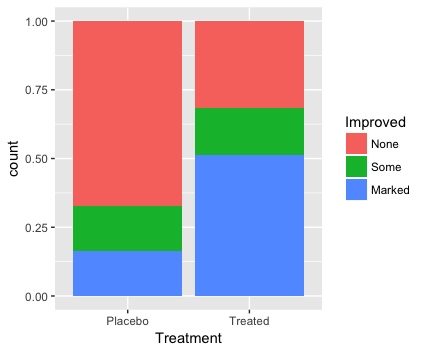
The bivariate analysis could be shown in terns oF stacked bar chart/ column chart/ dual axis bar chart.
1. Stacked bar chart - [ position = "stack"] - show proportion of each independent value of variable.

This chart shows 2 variables analysis in 1 axis.
Ex:
ggplot(mpg,
       aes(x = class,
           fill = drv)) +
  geom_bar(position = "stack")
or
ggplot(mpg,
       aes(x = class,
           fill = drv)) +
  geom_bar()
2. Side by side bar chart - [ position="dodge" ] - used for comaprison of 2 variables

Ex:
ggplot(mpg,
       aes(x = class,
           fill = drv)) +
    geom_bar(position = position_dodge(preserve = "single"))
3. Filled bar chart - [ position="fill" ] - used to show proportion of variables.

Ex:
ggplot(mpg,
        aes(x = class,
            fill = drv)) +
     geom_bar(position = "fill")
I found the examples and explanation about these examples from here
Hope it helps!
 REGISTER FOR FREE WEBINAR
X
 Thank you for registering
Join Edureka Meetup community for 100+ Free Webinars each month
JOIN MEETUP GROUP