Hi, even I was searching for this answer, I found the way later.
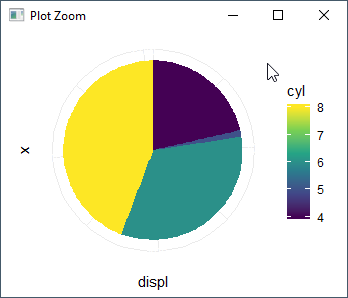
You need to use geom_bar and then later convert it to polar coordinates to get a pie chart.
Let me show an example,
mpg1 = mpg %>% arrange(cyl)

ggplot(mpg1,aes(x="",y=displ,fill = cyl))+geom_bar(stat = "identity")+coord_polar("y",start=0)+scale_fill_continuous(type = "viridis")+theme_minimal()+theme(axis.text = element_text(color = "white"))

 REGISTER FOR FREE WEBINAR
X
 Thank you for registering
Join Edureka Meetup community for 100+ Free Webinars each month
JOIN MEETUP GROUP