Hi,
You can create multiple charts in a sheet but there are limitations on the charts that can be put in the same sheet.
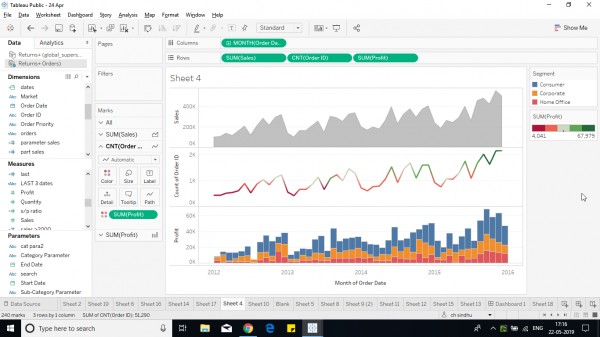
For Ex: Below is a chart, that contains an area chart, bar chart, and line chart,

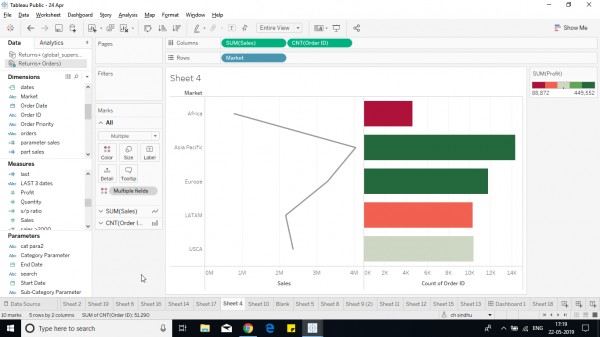
You can create charts with one column and multiple rows ot the vice versa.

Using common or relative column and rows would provide you better visualizing multi[ple charts.
Multiple charts in a sheet are created using 1 common field and other dimension or measure as per choice.
Hope it helps.
 REGISTER FOR FREE WEBINAR
X
 Thank you for registering
Join Edureka Meetup community for 100+ Free Webinars each month
JOIN MEETUP GROUP