Hi,
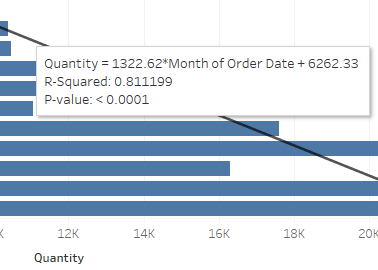
When you hover over the trend line it shows the line equation resembling the trend of the visual.
Sample equation -

Where R-squared denote the goodness of the fit and
P-value denotes measure of confidence
In a Trend Lines Model in Tableau, two measures are extremely important: P-Values and R-Squared. R-Squared (goodness-of-fit) is a measure of how well the data fits the linear model. It is the ratio of the variance of the model's error, or unexplained variance, to the total variance of the data.
 REGISTER FOR FREE WEBINAR
X
 Thank you for registering
Join Edureka Meetup community for 100+ Free Webinars each month
JOIN MEETUP GROUP