How do I use Python scripts in Power BI

0 votes
I have installed Anaconda and the latest version of Python on my local computer but still I am not able to integrate it with Power BI. There are the challenges I am facing:

1. There is no option for me to run scripts

2. No option available for the visualization

I have no idea how to enable them in my Power BI Desktop
May 2, 2019 in Power BI by Phalguni
• 1,020 points
2,466 views

1 answer to this question.

0 votes

Hi,

You can create interactive reports out of your data using Python scripts in Power BI.

In order to do so you need to enable python scripts option in Power BI so that it appears in the visualization pane.

Following are the steps in order to enable python scripts

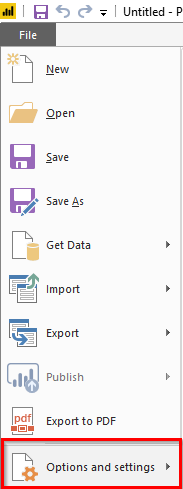
Step 1: Select Options and Settings from the file Menu
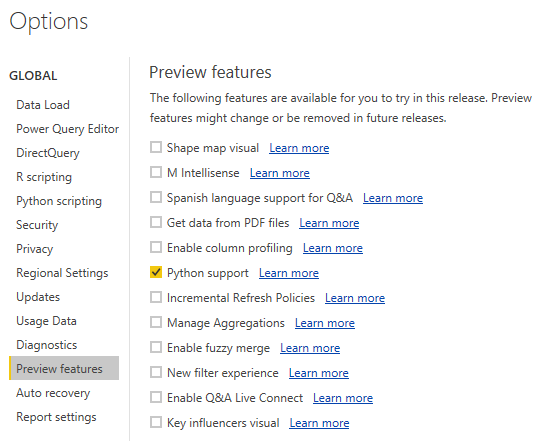
Step 2: Select Options and then check python support in preview features
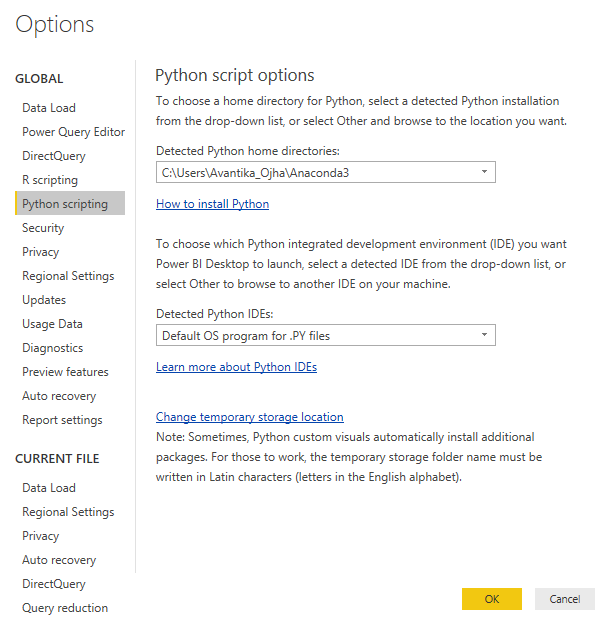
Step 3: Enable python scripts
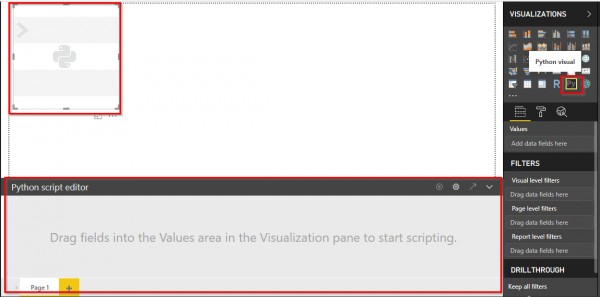
Step 4: Choose Python option from the visualization pane and write your Python scripts in the script editor
Now you can finally load you your data to power bi desktop and add fields to the python visualization using an external IDE or you can run your own python scripts as well.

Hope this helps!! 

answered May 2, 2019 by Avantika
• 1,520 points

Related Questions In Power BI

0 votes
1 answer

How do I use Python Visualizations in Power BI?

Hi, You can create interactive reports out of ...READ MORE

answered Apr 8, 2019 in Power BI by Phalguni
• 1,020 points
1,047 views
0 votes
0 answers
0 votes
0 answers

How can I use R or Python scripts within Power BI for advanced data analysis?

How can I use R or Python ...READ MORE

Oct 14, 2024 in Power BI by anonymous
• 9,880 points
90 views
0 votes
0 answers

How can I use R or Python scripts within Power BI for advanced data analysis?

How can I use R or Python ...READ MORE

Oct 22, 2024 in Power BI by Evanjalin
• 9,880 points
155 views
0 votes
1 answer

How To use R Integration in Power BI?

Hi,  There are a lot of packages available ...READ MORE

answered May 3, 2019 in Power BI by Avantika
• 1,520 points
2,665 views
0 votes
0 answers

How do you change the tables in chart filters?

I am working on a report that shows ...READ MORE

May 10, 2019 in Power BI by anonymous
653 views
0 votes
1 answer

How do you change the tables in chart filters?

Hi, You can use the following measure. Measure 2 = ...READ MORE

answered May 10, 2019 in Power BI by Avantika
• 1,520 points
650 views
0 votes
1 answer

How do I create a line chart?

Hi, From the data mentioned above, you can ...READ MORE

answered May 10, 2019 in Power BI by Avantika
• 1,520 points
740 views
0 votes
1 answer

How do I convert month format in Power BI?

Hi, This can easily be done using DAX ...READ MORE

answered Mar 27, 2019 in Power BI by Avantika
• 1,520 points
5,094 views
0 votes
1 answer

How do you use R visuals in Power BI Desktop?

Hi, In order to use R Visuals you ...READ MORE

answered Apr 10, 2019 in Power BI by Avantika
• 1,520 points
767 views
webinar REGISTER FOR FREE WEBINAR X
REGISTER NOW
webinar_success Thank you for registering Join Edureka Meetup community for 100+ Free Webinars each month JOIN MEETUP GROUP