Hi Nithin,
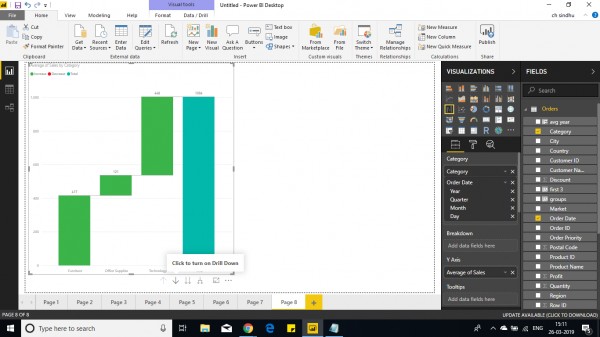
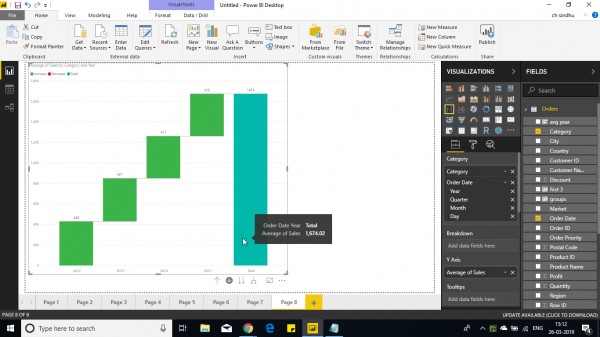
Follow these steps to make a waterfall chart to show average of sales yearly.
1. Select Waterfall chart from visualizations.
2. Drop sales in y-axis and convert it to average of sales by right clicking on the field, date and category field in category.
3. Select the down arrow button to show category year wise average sales.

4. Now click on the bar for each category to show split up year wise average.

Hope this helps you
 REGISTER FOR FREE WEBINAR
X
 Thank you for registering
Join Edureka Meetup community for 100+ Free Webinars each month
JOIN MEETUP GROUP