Hi, to split the columns using 2 dimensions/measures/combination in a bar chart color and size shelf are much preferred.
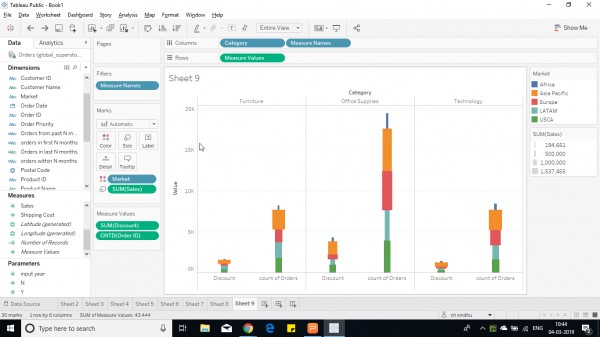
You can create a stacked side by side bar chart by using 2 measures or Dimensions( by aggregating them) and put in different shelf such as size and color. So the bar chart would be show 2 different values such as below.
Here, in the above stacked bar chart, i used market to denote color and sales to denote size. The above graph shows discount offered and number of orders per region and the sales in that region.
Hope this helps you.
 REGISTER FOR FREE WEBINAR
X
 Thank you for registering
Join Edureka Meetup community for 100+ Free Webinars each month
JOIN MEETUP GROUP