How do you create visualizations in Power BI

0 votes
Feb 27, 2019 in Power BI by Avantika
• 1,520 points
964 views

1 answer to this question.

+1 vote

Visualizations in Power BI

Visuals are the end-result of any business intelligence and Power BI offers many such visualizations that will help to prevent your data in an insightful way. Visuals in Power BI are the basic building blocks and are available in different categories such as charts, treemaps, gauges and various other page formatting tools.
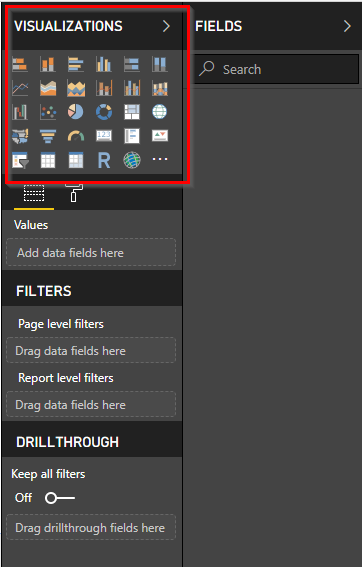
Visualizations can be created in two different ways in Power BI Desktop

  1. You can directly drag the type of visual on the report section depending upon the type of data
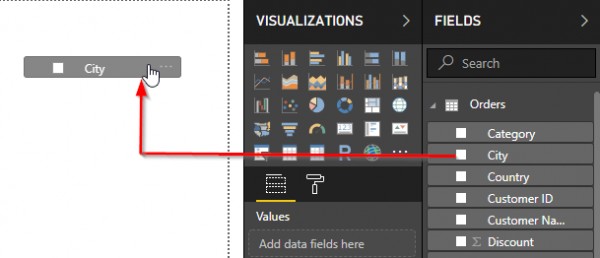
  1. Select your fields from the set of data> click on the visual from the visualization panel
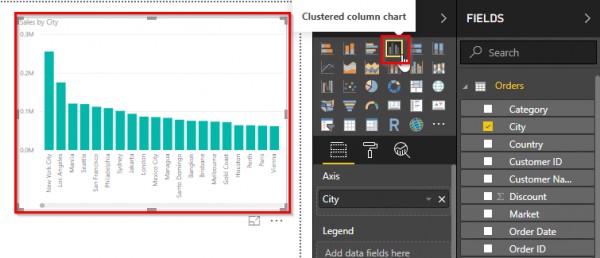
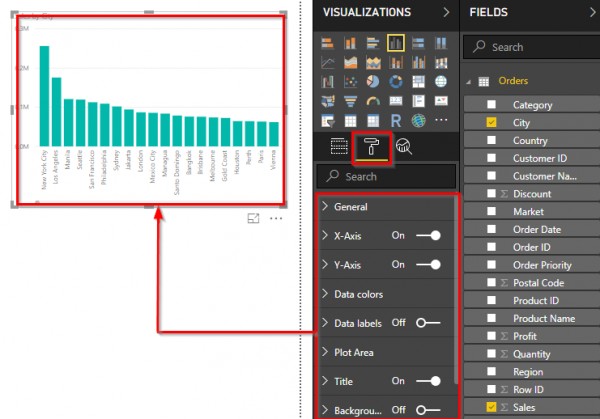
Once the visual has been created, it can now be customised accordingly ie. You can make changes in formats, fonts and alignment.
answered Feb 27, 2019 by Phalguni
• 1,020 points

Related Questions In Power BI

0 votes
1 answer

How do you create a link visual in Power BI?

You can easily create a link between ...READ MORE

answered Mar 9, 2019 in Power BI by Avantika
• 1,520 points

edited Mar 9, 2019 by Avantika 5,151 views
0 votes
1 answer

How do I use Python Visualizations in Power BI?

Hi, You can create interactive reports out of ...READ MORE

answered Apr 8, 2019 in Power BI by Phalguni
• 1,020 points
963 views
0 votes
1 answer

How do you use R visuals in Power BI Desktop?

Hi, In order to use R Visuals you ...READ MORE

answered Apr 10, 2019 in Power BI by Avantika
• 1,520 points
701 views
0 votes
1 answer

How do you run R script visual in Power BI Service?

Hi, It seems that your data format not recognized correctly ...READ MORE

answered May 21, 2019 in Power BI by Avantika
• 1,520 points

edited May 22, 2019 by Omkar 1,669 views
0 votes
1 answer

How do you schedule Data Refresh in Power BI?

Hi, Following could be the reasons why this ...READ MORE

answered May 21, 2019 in Power BI by Avantika
• 1,520 points
927 views
0 votes
1 answer

How do you add a new filter pane in old Power BI reports?

Hi, You can perform the following steps: 1. Open ...READ MORE

answered May 22, 2019 in Power BI by Avantika
• 1,520 points
1,431 views
0 votes
1 answer

How to create a new dashboard by pinning visualizations from a report in Power BI?

Hey, I can show some steps wise steps ...READ MORE

answered Feb 6, 2020 in Power BI by Gitika
• 65,770 points
1,072 views
0 votes
1 answer

How do you Hide and Unhide a Specific Report in Power BI?

In the menu bar, choose the Selection ...READ MORE

answered Oct 20, 2020 in Power BI by Gitika
• 65,770 points
10,627 views
0 votes
1 answer

How do you add a slicer from different table in Power BI?

In order to add a slicer from ...READ MORE

answered Mar 5, 2019 in Power BI by Phalguni
• 1,020 points
1,599 views
0 votes
1 answer

How do you embed dashboard using JavaScript in Power BI?

Dashboards in Power BI can be embedded ...READ MORE

answered Mar 5, 2019 in Power BI by Phalguni
• 1,020 points
2,050 views
webinar REGISTER FOR FREE WEBINAR X
REGISTER NOW
webinar_success Thank you for registering Join Edureka Meetup community for 100+ Free Webinars each month JOIN MEETUP GROUP