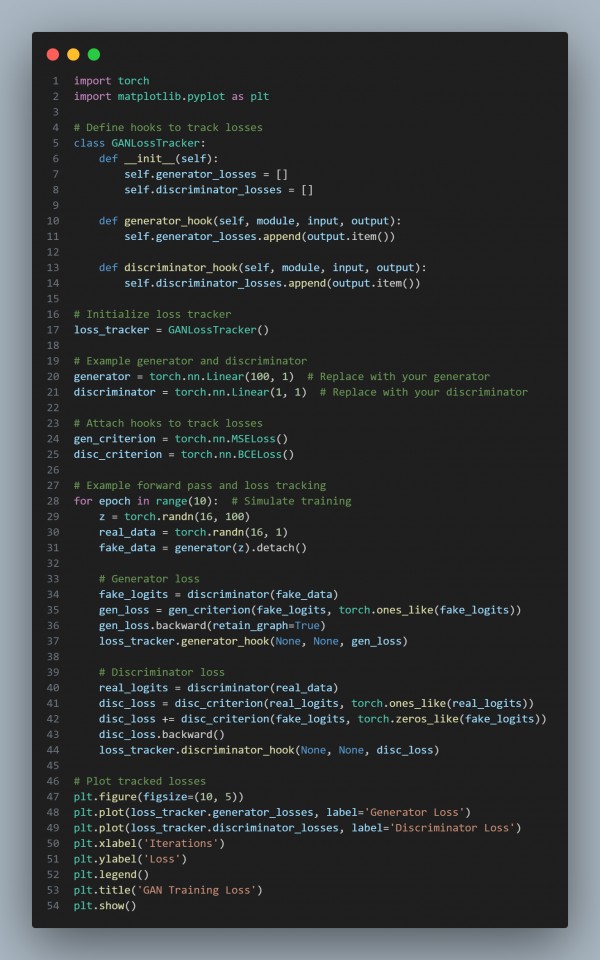
You can visualize training loss during GAN training in PyTorch using hooks to monitor the loss values for the generator and discriminator at each iteration. The losses can then be plotted using libraries like matplotlib.
Here is the code snippet you can refer for implementation:

The above code functions by:
- Custom Hooks: Attach hooks to the generator and discriminator loss calculations to log loss values during training.
- Loss Tracking: Use a custom class to store and later retrieve these values.
- Visualization: Use matplotlib to plot generator and discriminator losses over time, helping identify convergence or instability.
Hence, by referring to the above, you can visualize training loss during GAN training using PyTorch hooks.
 REGISTER FOR FREE WEBINAR
X
 Thank you for registering
Join Edureka Meetup community for 100+ Free Webinars each month
JOIN MEETUP GROUP