


Regarding business analysis, one popular query is, “How much effort do you spend in developing performance-tracking Excel dashboards?” The answer is normally “excessive.” However, there is good news regarding calculations involving Time Intelligence owed to Power BI. It saves time that would have otherwise been spent on calculations, analysis, and insights that matter more.
We will now examine a Use Case from the well-known company Swiggy that utilized Power BI and its Time Intelligence Functions.
Swiggy, India’s number one food delivery platform, faced further challenges in its journey to data-driven decision-making. Here is a brief highlight of the challenges they encountered while choosing the right BI tool, developing a healthy pipeline for workflows, and ushering in Time Intelligence functions at Power BI.

This Edureka video on the “Power BI Full Course” will help you understand and learn Power BI in detail. This Power BI Tutorial is ideal for both beginners as well as professionals who want to master their Power BI concepts.
Challenges Faced
- Scalability Problems: With over 500 cities for the operations and more than 120,000 partner restaurants, this was one of the few organizations that processed millions of customer orders every month, virtually Swiggy. This gave their existing BI tool a gallant attempt at handling data, which in turn caused critical performance bottlenecks.
- Complexity and Usability: With almost every other BI solution, there was time complexity and minimal usability, which made it difficult for teams to achieve mass acceptance. In fact, the sheer complexity of these BI solutions did not allow many employees to draw actionable insights on time.
- Data Silos: The data lies scattered all across various operational systems and thus forms silos that block comprehensive analysis and a single view of operations.
Choosing the Right BI Tool
To tackle these problems, Swiggy was looking for a BI tool that provided:
- Scalability: That is, handling very large datasets without performance compromises.
- User-Friendly Interface: Non-complex, all the teams could quickly adapt to it, thus driving a data-based culture.
- Integration Capability: Ability to seamlessly integrate with existing data sources so that silos could be destroyed and a holistic view of operations could be provided.
- After evaluating multiple products, Swiggy chose Microsoft Power BI for its strong feature set, scalability, and ease of use.
- Setting up a Concrete Data Pipeline: Power BI implementation, therefore, needs the setting up of a strong data pipeline to ensure the seamless flow of information. Swiggy took the following steps:
- Data Consolidation: Data from different sources were aggregated into a centralized data warehouse, thus ensuring consistency and accuracy.
- Data Cleaning and Transformation: Data cleaning techniques were used to remove data inconsistencies and transform data into a suitable format for analysis.
- Automation: The data extraction, transformation, and loading (ETL) processes were automated to update data in real time for analysis.
With this robust data pipeline, Power BI dashboards ensured real-time insights that enabled teams to make informed decisions at the calculated time.
Diving into Time Intelligence Functions in Power BI
The Time Intelligence functions in Data Analysis Expressions (DAX) in Power BI assist Swiggy in going deep into time-based analyses. The main functions used here are:
- TOTALYTD: Enables calculations of the year-to-date metrics for performance tracking against annual targets.
- SAMEPERIODLASTYEAR: Comparison of current performance with the same period of the previous year for a year-on-year analysis.
- DATEADD: Shifts the date by an interval to allow a custom date comparison.
- Using these functions, Swiggy was able to study trends across different timescales: daily, monthly, and yearly. This provided assessments on seasonal demand variations and patterns of growth, with the aim of achieving insight.
Solutions Implemented
- Data Accessibility: The very nature of Power BI dashboards puts data into the hands of all relevant stakeholders across the organization, ensuring a culture of data-driven thinking.
- Performance Monitoring: Real-time analytics allowed Swiggy to monitor the key performance indicators (KPIs) quite effectively, thus enabling optimization of delivery time and appropriate resource allocation.
- Strategic Decision Support: Time-based insights drove marketing campaigns during peak seasons and aided expansion strategies in new markets.
This strategic implementation of Power BI, along with the establishment of a robust data ecosystem, helped Swiggy overcome its initial challenges, thereby giving efficiency to its operational processes and securing its footing as a strong incumbent in the competitive arena of food delivery.
Now that we understand the concept of running totals, let’s dive into Time Intelligence functions, which play a crucial role in analyzing data over time.
What are Time Intelligence functions for?
Power BI’s Time intelligence features enable users to evaluate company performance calculations while they’re on the road without having to save them separately on a separate sheet for later use. Data Analysis Expressions (DAX), a calculation-like feature in Microsoft Power BI, helps the user extract new dimensions from the data. Any Power BI developer can use time intelligence functions as baseline formulae to analyze how business indicators have changed over time (annually, quarterly, compared to last year, etc.) The purpose of DAX’s Time Intelligence Functions is to facilitate date—and time-related computations and analysis. These features make it simple for users to compare data over time, compute values from one quarter or year to date, spot trends, and carry out other time-based analyses.
Now you know what the Time Intelligence Function used, we will discuss the Prerequisite – Getting the Data
Prerequisite – Getting the Data
- Basic Requirement: Getting the Measures entails making provisions for your data before bringing it into Power BI for analysis.
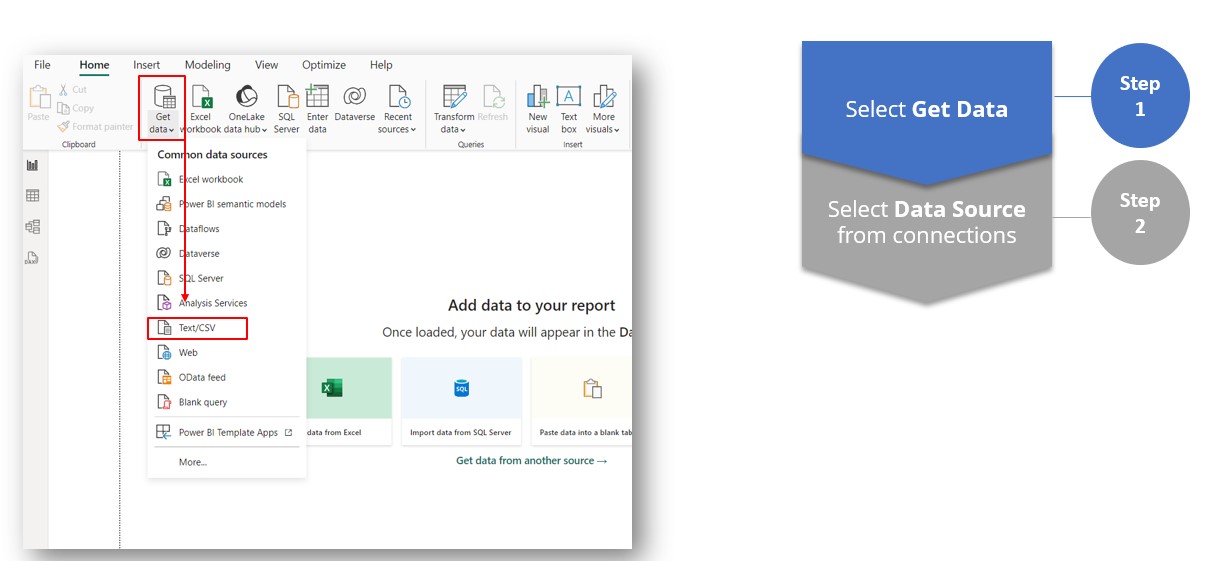
- Key steps include: Identify the location of the data e.g., Excel files, databases, cloud services, or web APIs, and confirm accessibility and permissions.
- Data Sources Identification: Ensure that the data is properly formatted (for instance, in tables) and does not contain erroneous values such as nulls or duplicates.
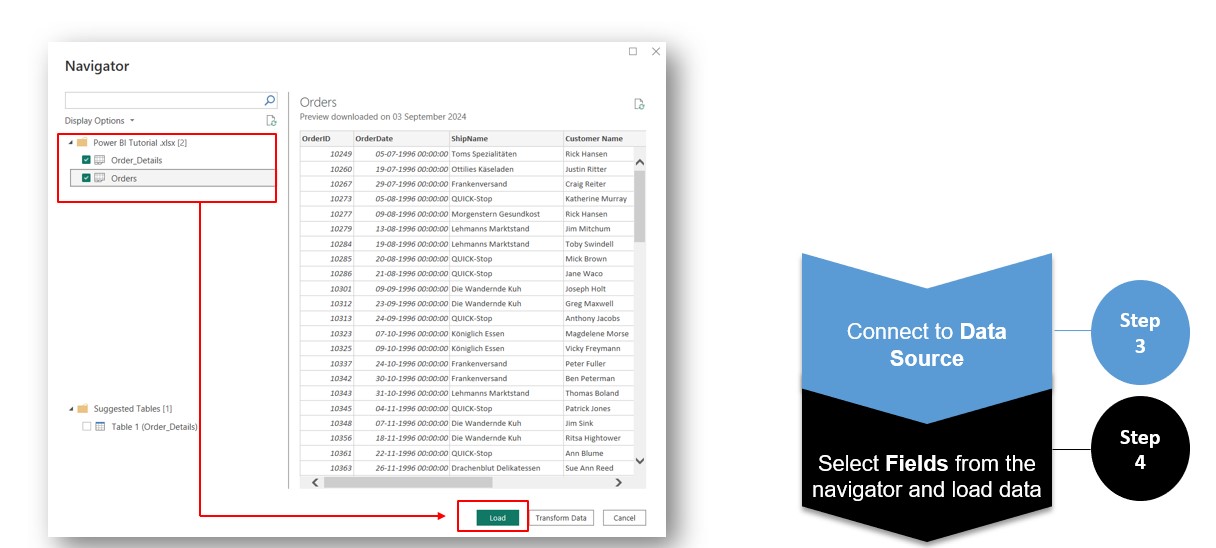
- Data Preparation: Use the Get Data option in Power BI to add Power BI-compatible data sources and enable data download.
- Connect to Power BI: Without a doubt, adequate preparation allows for a smooth analysis process when analyzing Power BI.
Next, we’ll explore various examples of Time Intelligence functions and how they can be used to gain deeper insights into time-based data
Exploring different Time Intelligence Examples
The DAX integrates unique time intelligence functions that permit the assessment of data over particular time intervals such as Year-to-Date, Quarter-to-Date, and Moving Annual Totals.
Below, you will find an explanation as well as implementations of them with examples in Power BI
1. Year-to-Date (YTD), Quarter-to-Date (QTD), and Month-to-Date (MTD)
In general terms, all information is aggregated from the beginning of some interval to the present moment.
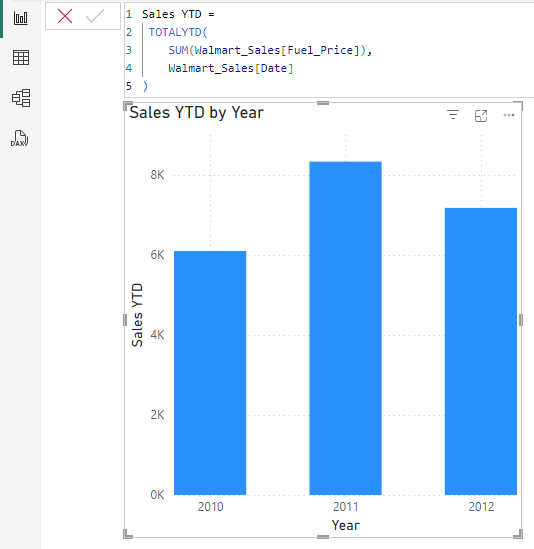
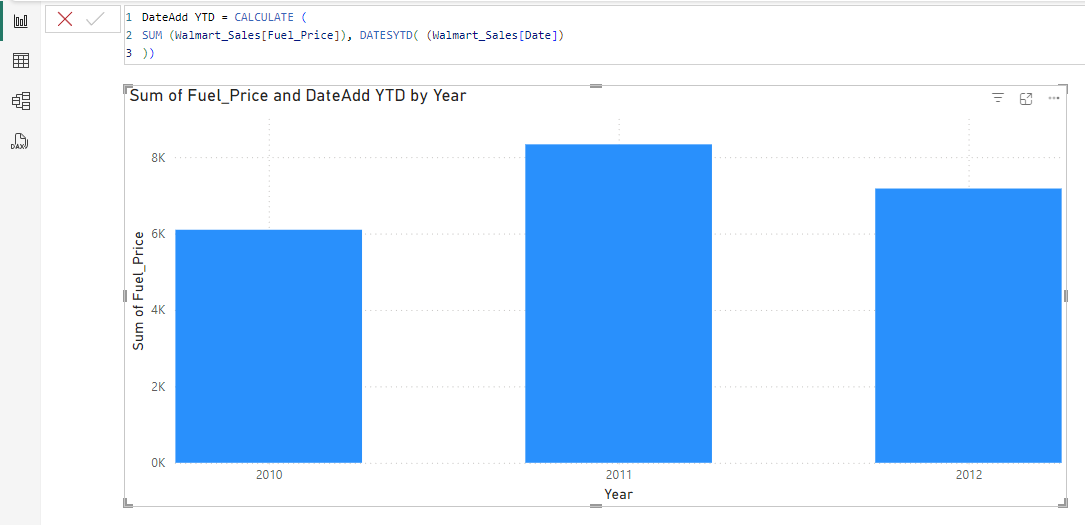
- Year-to-Date:
All the statistics are summed up from the beginning of the year to a specific timeframe and the formula is
Sales YTD = TotalYTD(SUM('Walmart_Sales[Fuel_Price]),Walmart_Sales[Date])
The FUNCTION: TOTALYTD calculates a measure’s value up to a given date for the current year.
Measure: SUM('Walmart_Sales'[Fuel_Price]) gives the total of the column Fuel_Price.
Date Column: ‘Walmart_Sales'[Date] must be the well-formatted date field in your data model.
Note:
The Date column in Walmart_Sales is continuous and part of a valid date table marked in your data model.
Fuel_Price is the intended metric for this calculation. If not, replace it with the correct column.

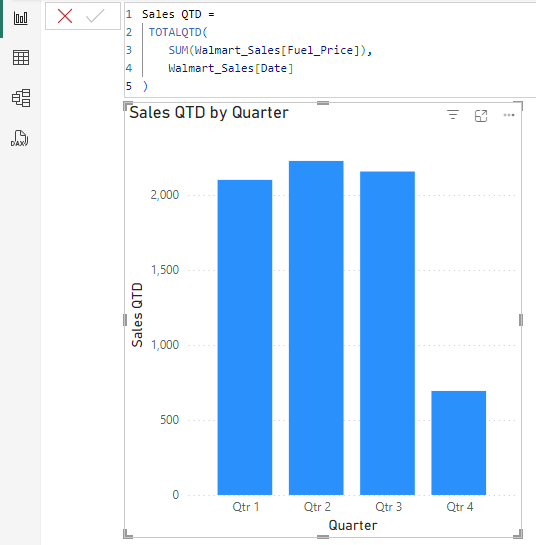
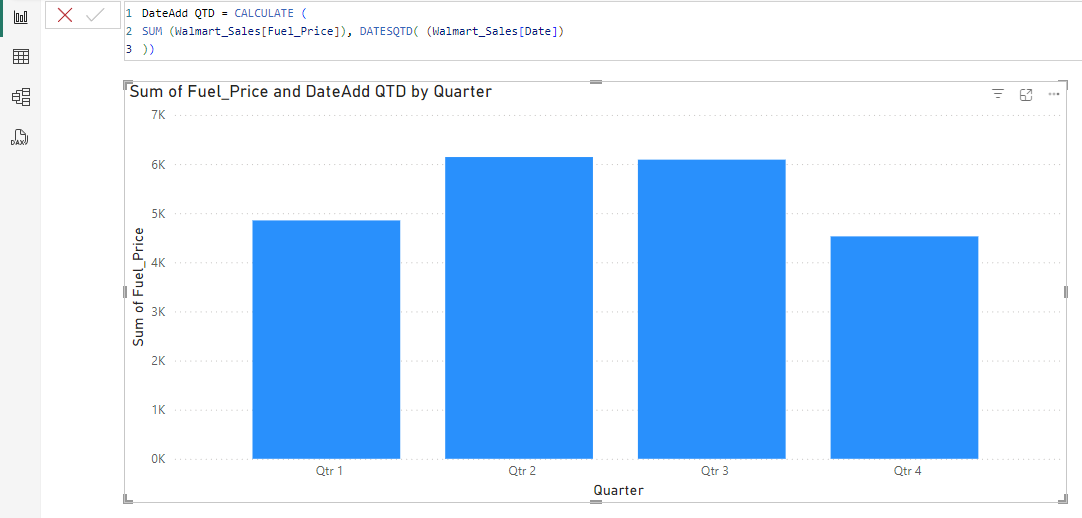
- Quarter-to-Date (QTD):
It is a time measure that encompasses data collected from the beginning of the quarter to a particular date as selected
Sales QTD = TotalQTD(SUM(Walmart_Sales[Fuel_Price]),Walmart_Sales[Date])
TOTALQTD: Counts Total from the Beginning of this Quarter up to a date specified.
SUM: Fetches Fuel_Price column values. Date: This column has to be part of a correctly configured date table to deliver accurate results.
Calculation: Be sure to create a non-abbreviated date table and mark it as a Date Table in Power BI.
Note:
If you are calculating for a different metric, replace Fuel_Price with this column. Use this measure in your report visuals for QTD insights.

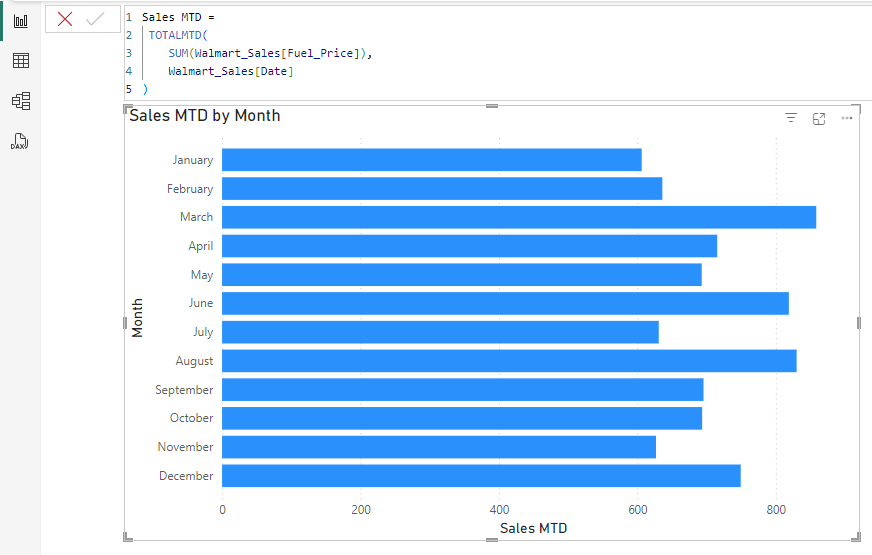
- Month-to-Date (MTD):
Compiles information from the beginning of the month to the date specified.
Sales MTD = TOTALMTD(SUM(Walmart_Sales[Fuel_Price]),Walmart_Sales[Date])
Function: TOTALMTD computes the running total for the current month until the Date is given.
Measure: SUM('Walmart_Sales'[Fuel_Price]) aggregates the amounts from Fuel_Price column.
Date Column: 'Walmart_Sales'[Date] must, therefore, be part of a valid and marked date table in your data model.
Note:
Remember to define your date table as the Date Table in Power BI so that proper time intelligence calculations can be achieved.
If you want to calculate a given column, substitute Fuel_Price with the intended metric.

2. Comparing Current Time Periods to Earlier Time Periods
Time intelligence permits some differences or comparisons to be computed and contemplated, for example, whether sales this year are greater or fewer than sales last year or the rate of growth compared on a month-on-month basis.
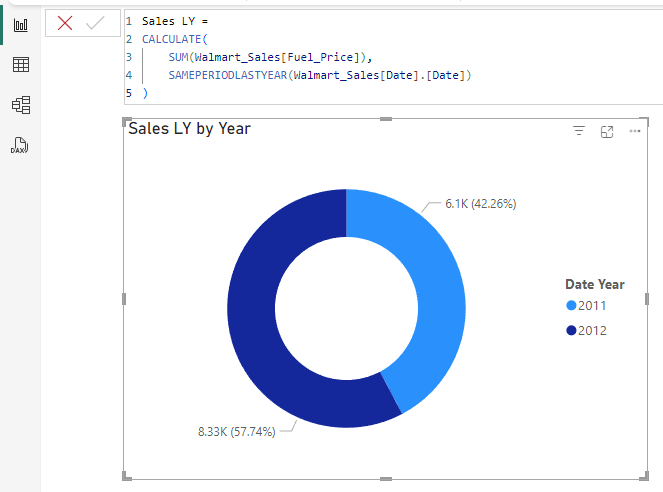
- Sales In The Previous Year(Same Period Previous Year):
Here, you take advantage of the same period last year by using a particular function called SAMEPERIODLASTYEAR.
Sales LY = CALCULATE(SUM(Walmart_Sales[Fuel_Price]),SAMEPERIODLASTYEAR(Walmart_Sales[Date],[Date]))
Calculate: This should, therefore, change the context into time intelligence for the calculation.
Now, SUM: Should this represent the m of the Futhe el_Price column (in case the sathe les column needs to be used, you may replace it)?SAMEPERIODLASTYEAR: It changes the data context to the same period one year back.
Notes:
The date column must be properly added to a Date Table marked in Power BI.
The Date table must certainly cover all periods encountered in the dataset to avoid non-captured data from calculations.

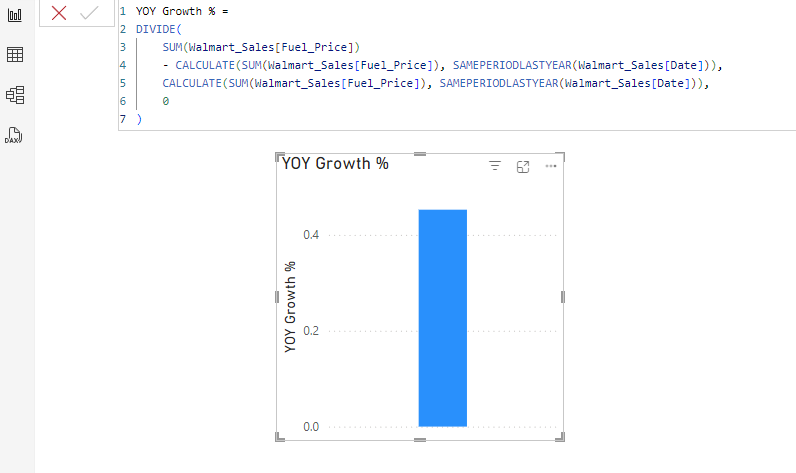
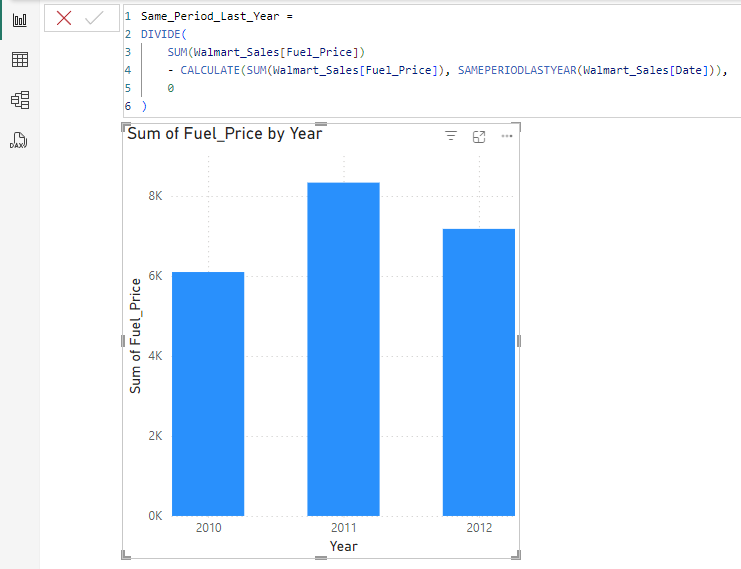
- Growth Over Last Year (YOY % Change):
Assess the proportionate difference between the prevailing and preceding year values.
YOY Growth % = DIVIDE(
SUM(Walmart_Sales[Fuel_Price]) - CALCULATE(SUM(Walmart_Sales[Fuel_Price]), SAMEPERIODLASTYEAR(Walmart_Sales[Date])),
CALCULATE(SUM(Walmart_Sales[Fuel_Price]),SAMEPERIODLASTYEAR(Walmart_Sales[Date])), 0)
Current Year Sales: SUM('Walmart_Sales'[Fuel_Price]) sums the sales in the current period
Previous Year Sales: calculates the same for the last period using CALCULATE(SUM('Walmart_Sales'[Fuel_Price]), SAMEPERIODLASTYEAR('Walmart_Sales'[Date])). Thus, the YOY Formula would read as (Current Year - Previous Year) / Previous Year.
The DIVIDE function wraps up the whole exercise, thereby ensuring that division errors are not possible since they are replaced by 0 when the denominator becomes 0 in such a case.
Notes:
Change Fuel_Price to your sales or revenue column. This must have a minimum continuous date column marked as a Date Table so the time Intelligence calculations will work properly. This measure should be displayed in a table or chart for visual indication of YOY growth.

3. Calculating Moving Annual Total
A Moving Annual Total accumulates data over the last twelve months on a continuous basis. This is useful for monitoring changes in performance over time.
- Moving Annual Total (12-Month Rolling)
Use the DATESINPERIOD function:
MAT Sales = CALCULATE(
SUM(Walmart_Sales[Weekly_Sales]),
DATESINPERIOD(Walmart_Sales[Date], MAX(Walmar_Sales[Dte]), -1, Year))
Calculate: This manipulates the context under which the computation is done to include the timeframe you desire.
DATESINPERIOD: This generates a rolling 12-month period ending at the present Date:
MAX(‘Walmart_Sales'[Date]): This retrieves the maximum Date within the current context.
-1: This means the length of time into the past being evaluated, which would be one year.
Year: This refers to the granularity of the period (years rolling).
SUM: This totals values in the Fuel_Price column during the specified time.
Notes:
Where necessary, use Fuel_Price in your aggregate column for things such as sales or revenue.
The Date column should form part of a properly configured Date Table.
Then, you use this measure in visuals to view rolling yearly totals dynamically.
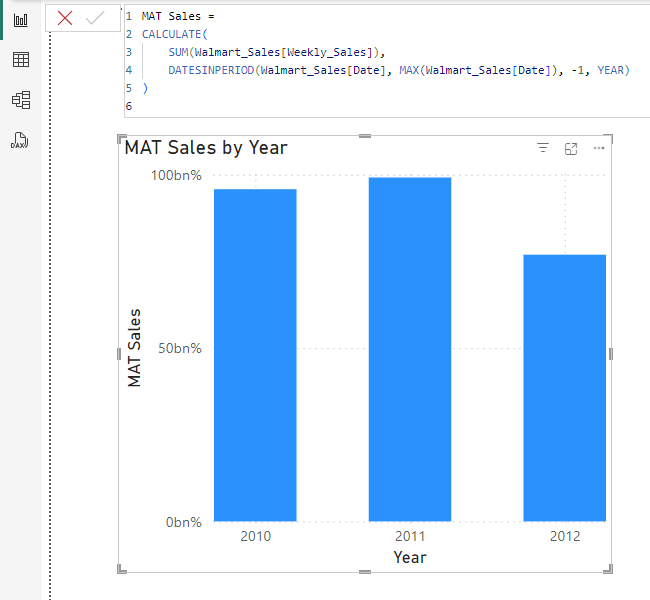

This computes the total revenue for the past twelve months from the latest chosen date.
Here’s a comprehensive list of Time Intelligence functions in DAX, along with their descriptions, to help you perform advanced time-based calculations in Power BI.
A List of Time Intelligence Functions (Name and Description)
The DAX language incorporates functions that enhance the ability to perform time-based analysis. These functions serve the purpose of calculating values for a specific time interval, comparing intervals, and monitoring steady-state behavior. Below is a very detailed and exhaustive account of most of the useful functions:
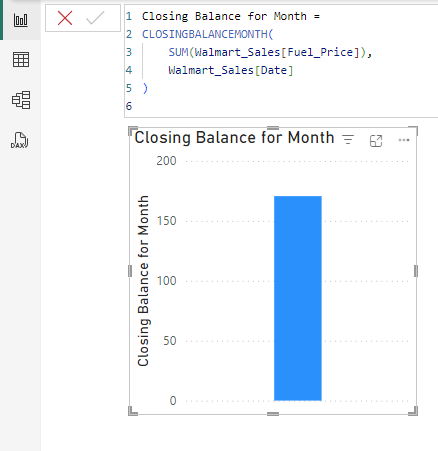
1. CLOSINGBALANCEMONTH
The CLOSINGBALANCEMONTH() function in DAX for Power BI computes the value of the given expression also known as a measure, for the last date of the month which is in the scope of the predefined context of time.
- Syntax :
CLOSINGBALANCEMONTH(<expression>,<dates>[,<filter>])
- Example :
=CLOSINGBALANCEMONTH(SUM(TransactionData[Revenue]),CalenderDate[Date])
CLOSINGBALANCEMONTH: This function returns the value of this measure at the last Date in the month, which is within the current filter context.
SUM(TransactionData[Revenue]): This function summarizes the Revenue column from the TransactionData table.
CalendarDate[Date]: To ensure accurate calculations, the date column used must be from a properly configured Date Table.
Notes:
Make sure this Date column is part of a continuous and marked Date Table in your data model.
This measure can be used to show monthly closing balances in a table, matrix, or chart visual.

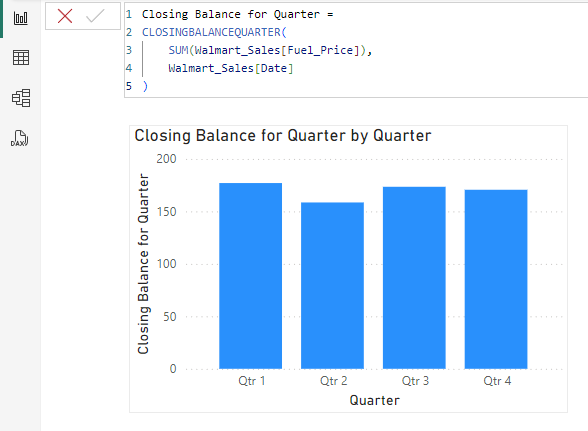
2. CLOSINGBALANCEQUARTER
The CLOSINGBALANCEQUARTER() function in DAX time intelligence—Power BI calculates its argument as of the last day of the most recently completed quarter, based on the current context.
- Syntax :
CLOSINGBALANCEQUARTER(<expression>,<dates>[,<filter>])
- Example :
=CLOSINGBALANCEQUARTER(SUM(TransactionData[Revenue]),CalenderDate[Date])
CLOSINGBALANCEQUARTER: Captures the value of a measure (i.e., the total revenue) on the last day of the current quarter.
SUM(TransactionData[Revenue]): Sums the Revenue column from the TransactionData table.
CalendarDate[Date]: The Date column has to belong to a valid and properly configured Date Table.
Notes:
To get the correct results, make sure that the CalendarDate[Date] column is marked as a Date Table in Power BI before any query.
Use this measure as a visualization to show quarter-closing balances, such as in a matrix or line chart.

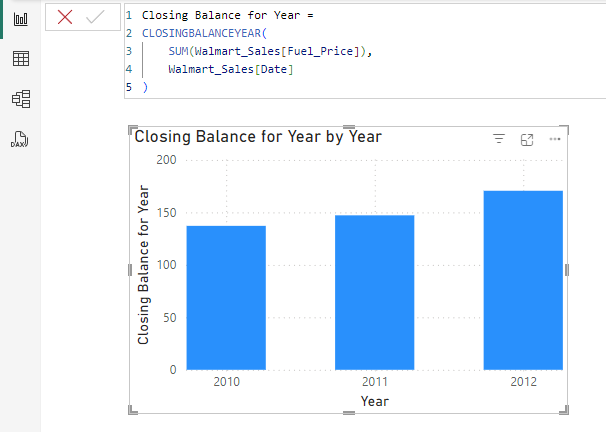
3. CLOSINGBALANCEYEAR
CLOSINGBALANCEYEAR() is a time intelligence DAX function available in Power BI that computes the value of the expression at the last date in the year of the current context.
- Syntax :
CLOSINGBALANCEYEAR(<expression>,<dates>[,<filter>][,<year_end_date>])
- Example :
=CLOSINGBALANCEYEAR(SUM(TransactionData[Revenue]),CalenderDate[Date])
CLOSINGBALANCEYEAR: This returns the measured value of a particular measure (e.g., total revenue) on its last Date defined within the current year.
SUM(TransactionData[Revenue]): This function collects the Revenue column present in the TransactionData table.
CalendarDate[Date]: The Date column is extracted from a valid Date Table, which is mandated for accurate time intelligence calculations.
Notes:
Date Table: Make sure the CalendarDate[Date] column belongs to a properly marked Date Table in Power BI.
Purpose: This measure could be used to mark the year’s close value in a table or matrix or visible in a bar or line chart.

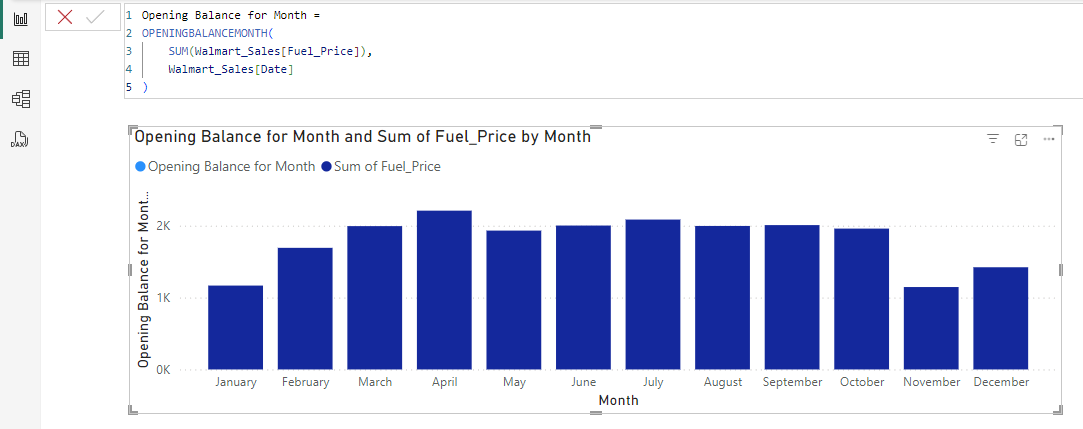
4. OPENINGBALANCEQTR
In Power BI, the time intelligence DAX function OPENINGBALANCEMONTH() calculates a given expression as of the last day in the month just completed for applying the filters.
- Syntax :
OPENINGBALANCEMONTH(<expression>,<dates>[,<filter>])
- Example :
=OPENINGBALANCEMONTH(SUM(TransactionData[Revenue]),CalenderDate[Date])
OPENINGBALANCEMONTH: This function returns the measured value for the first Date in the month within the filter context: in this case, it will return the total revenue.
SUM(TransactionData[Revenue]): This is an aggregation of the Revenue column from the TransactionData table.
CalendarDate[Date]: The Date column must come from a valid Date Table for calculation purposes.
Notes:
Make sure that the CalendarDate[Date] column is part of a properly configured Date Table and fully marked in Power BI.
It will present the monthly opening balances in reports and visuals such as tables or charts.

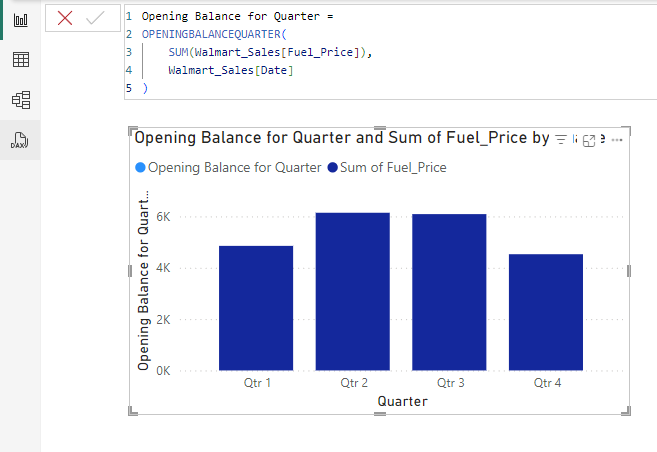
5 . OPENINGBALANCEQUARTER
The DAX function OPENINGBALANCEQUARTER(), used for time intelligence in Power BI, evaluates a given expression for the end date of the current period’s quarter filters, excluding the specified filters.
- Syntax:
OPENINGBALANCEQUARTER(<expression>,<dates>[,<filter>])
- Example :
=OPENINGBALANCEQUARTER(SUM(TransactionData[Revenue]),CalenderDate[Date])
REST of OPENINGBALANCEQUARTER: This function takes the value of the measure on the first date of the quarter within the current filter context (e.g., total revenue).
SUM(TransactionData[Revenue]): This will take the Rewards column in TransactionData.
The Date column must be from a valid Date Table to ensure proper time intelligence calculations.
Notes:
Ensure that the CalendarDate[Date] column is part of a valid date table marked in Power BI.
It will also be useful in reports and visuals for creating measures opening balances by quarter.

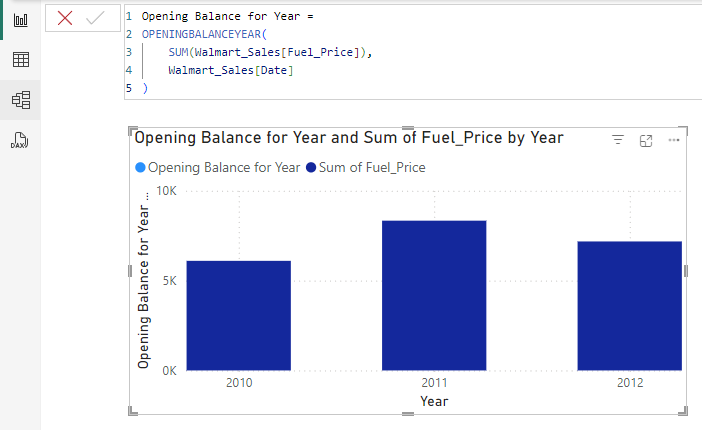
6 . OPENINGBALANCEYEAR
INTRODUCTION TO OPENINGBALANCEYEAR() FUNCTION IN DAX BY POWER BI: The Power BI time intelligence DAX function, OPENINGBALANCEYEAR(), Evaluates the specified expression for the date corresponding to the end of the previous year after applying specified filters.
- Syntax :
OPENINGBALANCEYEAR(<expression>,<dates>[,<filter>][,<year_end_date>])
- Example :
=OPENINGBALANCEYEAR(SUM(TransactionData[Revenue]),CalenderDate[Date])
OPENINGBALANCEYEAR: It returns the value of that measure (like revenue) on the first Date of the year in the current filter context of the report.
SUM(TransactionData[Revenue]): This means it sums the revenue column from the TransactionData table.
CalendarDate[Date]: The Date column must be from the proper Date Table to calculate time intelligence accurately.
Notes:
Make sure the CalendarDate[Date] column is from a valid Date Table marked in Power BI.
This measure is typically used in reports or visuals to display opening balances at an annual frequency.

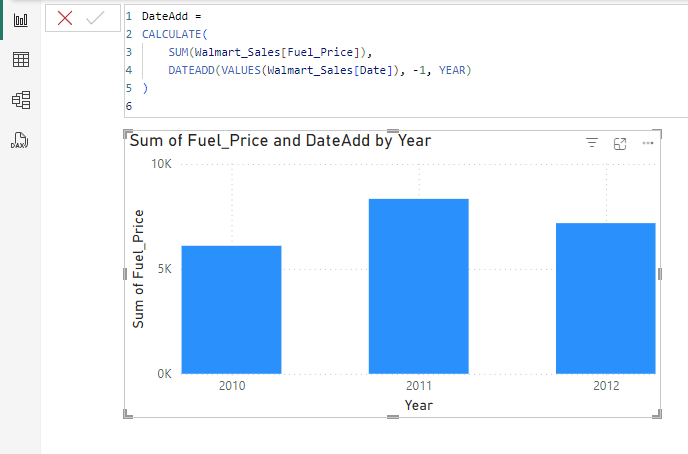
7. DATEADD
The DATEADD() function is a DAX time-intelligence function that is used in Power BI to create a table with a date column that can either be pushed forward or backward in time from the dates within the current context tableau and for a specified number of intervals.
- Syntax :
DATEADD(<dates>,<number_of_intervals>,<interval>)
- Example :
= CALCULATE([Total Sales],DATEADD(Dates[Date],-1,YEAR))
CALCULATE: Settings make the calculation context suitable for time intelligence functions such as DATEADD.
[Total Sales]: This would be a measure to calculate total sales (like SUM(TransactionData[Revenue])).
DATEADD(Dates[Date], -1, YEAR): The DATEADD function actually shifts the Date by one year back:
Dates[Date]: This one refers to the Date column from your Date Table; be sure it is marked as Date Table.
-1: Moving a year back.
Year: The granularity of change is one year.
Notes:
The dates table is correctly configured and marked Date Table.
This formula calculates the sales for the same period last year and hence is used for comparisons or YoY (Year-on-Year) growth calculations.

In the above expression, you can play with the second parameter of the DataADD function.
Minus -1 means you are subtracting one year from the current year, and if you remove the minus sign, then you are adding one year to the current year.
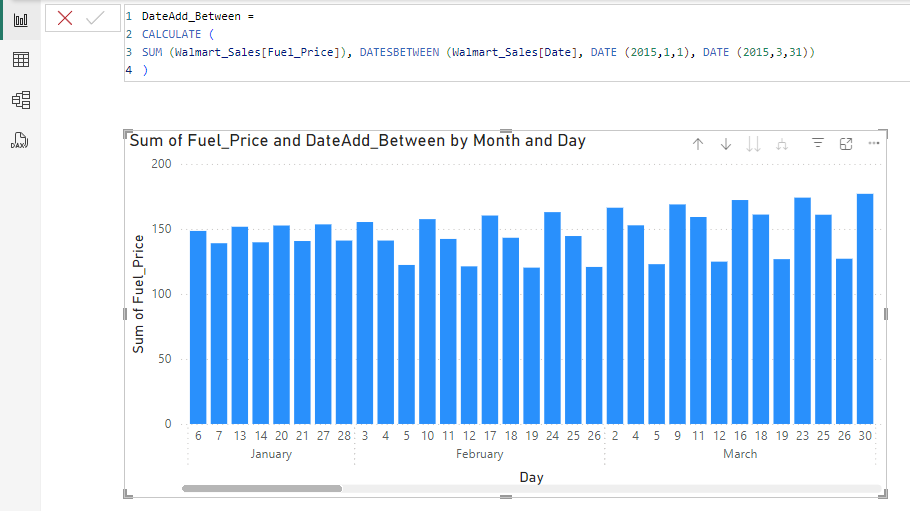
8 . DATES BETWEEN
One of the functions used in time intelligence in Power BI DAX is known as DATESBETWEEN (), it provides the set of dates which are falling between the two dates that are provided.
- Syntax :
DATESBETWEEN(<Dates>, <StartDate>, <EndDate>)
- Example :
= CALCULATE (SUM (Sales[Sales Amount]), DATESBETWEEN (Sales[Date], DATE (2015,1,1), DATE (2015,3,31)))
CALCULATE: Modifies the context in which the calculation is applied according to the arguments in the second one.
SUM(Sales[Sales Amount]): The total sales amount in the Sales table.
DATES BETWEEN(Sales[Date], DATE(2015, 1, 1), DATE(2015, 3, 31)): In fact, limits the Sales[Date] column to only those days between 1 January 2015 and 31 March 2015
Sales[Date]: This column shows the Date of the Sales table.
DATE(2015, 1, 1) and DATE(2015, 3, 31): These are the minimum and maximum dates from the range, respectively.
Note:
Ensure Sales[Date] is fitted from a proper Date Table when doing time-related calculations.
This measure can also be useful in cases where total sales values are required for any arbitrary date range, such as quarters or user-defined periods.

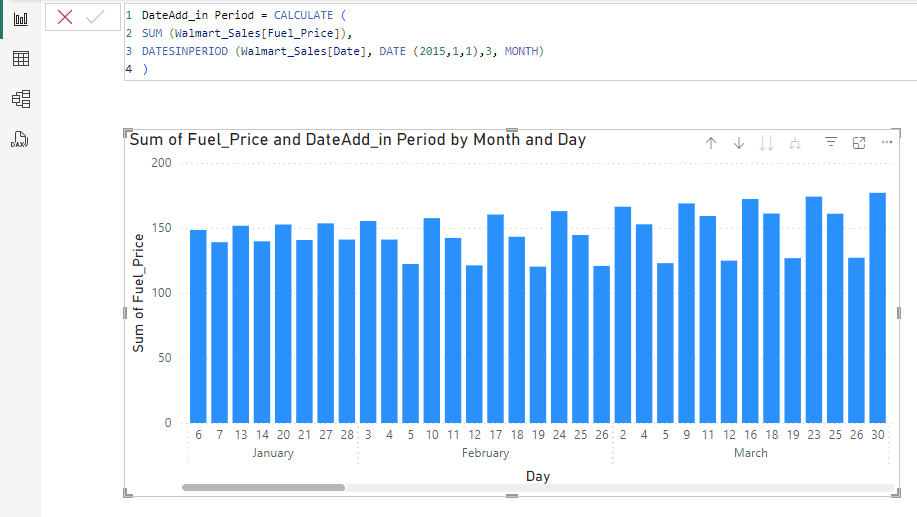
9. DATESINPERIOD
The DAX function DATESINPERIOD() serves time intelligence purposes in Power BI and creates a table with one date column starting at the specified start_date and extending for the number_of_intervals.
- Syntax :
DATESINPERIOD(<dates>, <start_date>, <number_of_intervals>, <interval>)
- Example :
= CALCULATE (SUM (Sales [Sales Amount]),DATESINPERIOD (Sales[Date], DATE (2015,1,1),3, MONTH))
CALCULATE: Places the calculation in the context of filters
SUM(Sales[Sales Amount]): Sum of the Sales Amount column in the Sales table.
DATESINPERIOD(Sales[Date], DATE(2015, 1, 1), 3, MONTH): Filters the Sales[Date] column from January 1, 2015, for 3 months:
Sales[Date]: Represents the date column in the Sales table.
DATE(2015, 1, 1): Starts the period.
3: Represents the number of months.
MONTH: Represents the unit of time (3 months in this case).
Note:
This formula allows the calculation of sales starting from January 1, 2015, for 3 months, meaning up to March 31, 2015.
This metric is useful for calculating the sales over a dynamic time, for example, rolling 3-month periods.

10 . DATESMTD
In Power BI, the DAX expression DATESMTD() is a time-based intelligence function that returns a table containing one column of the dates for the current month upto the current date within the existing filter context.
- Syntax :
DATESMTD(<dates>)
- Example :
= CALCULATE (SUM (Sales [Sales Amount]), DATESMTD (Sales [Date]))
CALCULATE: Modifies the filter context under which this sum is calculated.
SUM(Sales[Sales Amount]): Sums the Sales Amount column from the Sales table.
DATESMTD(Sales[Date]): This function filters the Sales[Date] column to select only the date range, starting from the month to the current Date. It is a time intelligence function that adjusts itself according to the readings about this month’s days.
Sales[Date]-The Date column from the Sales table.
DATESMTD functions in the context of the Current Date.
Note:
Month-to-date MTD will capture sales for the current month until the last Date available on the filter context, including the sales for that Date.
The Sales[Date] column must be related to a Date Table to get proper time intelligence calculations.
This measure could be used in report/dashboard scenarios, showing sales until that Date in the month.


11 . DATESQTD
This function is found in the time intelligence section of the DAX functions in Power BI. The DATESQTD() function generates a table with one column containing a list of dates of the active quarter, as per the current context.
- Syntax :
DATESQTD(<dates>)
- Example :
= CALCULATE (SUM (Sales [Sales Amount]), DATESQTD (Sales [Date]))
Calculation: OVERWRITE: This is how the function alters the context within which the data would be analyzed as per the assigned filters.
SUM(Sales[Sales Amount]): The sum of Sales Amount from the Sales table.
DATESQTD(Sales[Date]): This filters out the dates from the date of beginning to today’s date in the Sales[Date] column as follows:
–Sales[Date]: It is the definite column from the Sales table.
– DATESQTD is a time intelligence function that is automatically updated to the current quarter.
Notes:
Quarter-to-date (QTD) gives the total sum of sales from the beginning of the current quarter to the most recent date in the filter context.
– Be sure to have Sales[Date] as part of a Date Table for proper time intelligence to work.
This measure informs you of the sales performance during the current quarter up till today’s date.

12 . DATESYTD
The DAX function found in Power BI called DATESYTD is a time intelligence function that provides a table that includes all the dates between the start of the financial year and the maximum date in the data model.
- Syntax :
DATESYTD(<dates> [,<year_end_date>])
- Example :
= CALCULATE(SUM(Sales [Sales Amount]), DATESYTD(sales[Date]))
CALCULATE Changes the filter context for the summation calculation.
SUM(Sales[Sales Amount]): Sums the Sales Amount column from the Sales table.
DATESYTD(Sales[Date]): Filters the Sales[Date] column to only include dates from the beginning of the current year to this Date. A time intelligence function that defines this based on the current year:
Sales[Date]: The Date from the Sales table.
DATESYTD returns dates from the beginning of the year running up to the most current Date from the filter context.
Notes:
Year-to-date (YTD) will, therefore, give the total sales from the current year to the date that is the most up-to-date date available in the filter context.
For time intelligence calculations to work properly, the Sales [Date] column must be part of a data table.
This measure would be useful for reporting sales performance from the start of the year until this point in the year.

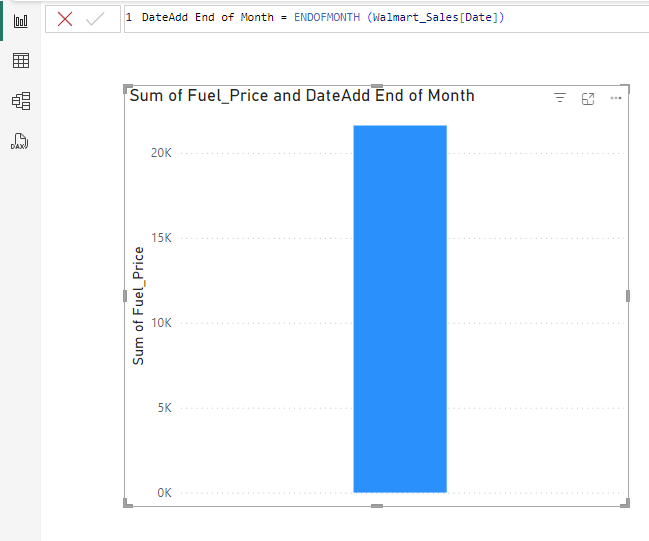
13 . ENDOFMONTH
The END OF MONTH () DAX function from the time intelligence function in Power BI functionality takes the last day of the relevant current column month with respect to the dates hierarchy in the current context.
- Syntax :
END OF MONTH(<dates>)
- Example :
= END OF MONTH (Sales [Date])
END OF MONTH (Sales[Date]): This returns the end date for each date listed in the column Sales[Date]. Thus, if it occurs on March 15, 2024, the end of the month returns the value.
For instance, March ends on the last day of that month, March 31, 2024.
Note:
The function is extremely useful when you want to summarize data at the end of the month or when performing calculations that rely on the very last day of the month.

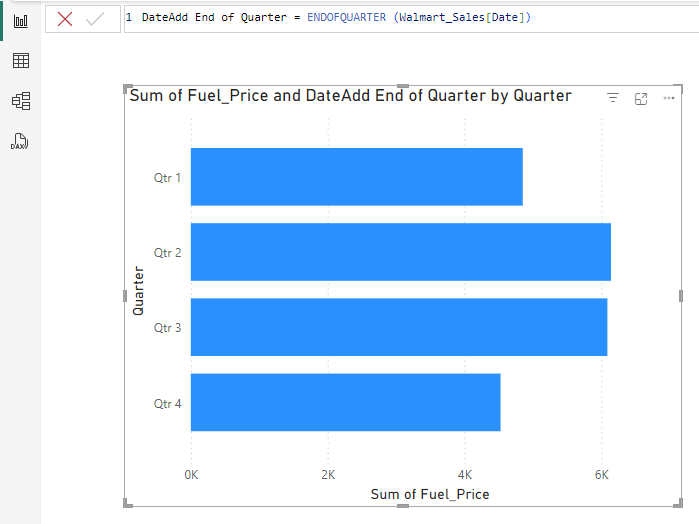
14 . ENDOFQUARTER
The Power BI time intelligence DAX function ENDOFQUARTER() returns the last date of the quarter in the current context for the specified column of dates.
- Syntax :
ENDOFQUARTER(<dates>)
- Example :
= ENDOFQUARTER (Sales [Date])
END OF QUARTER (Sales[Date]): This gives the last date of the quarter corresponding to each date in the Sales[Date] column.
For example, if the date is March 15, 2024, the output will be March 31, 2024 (end of Q1). If it is July 10, 2024, it will return on June 30, 2024 (end of Q2).
Note:
It is useful when people have to calculate something, like quarter-end totals, or summarise data for the end of each quarter in their reports or dashboards.

15. END OF YEAR
The Power BI time intelligence DAX feature ENDOFYEAR() returns the final date of the current context’s year in given column of dates.
- Syntax :
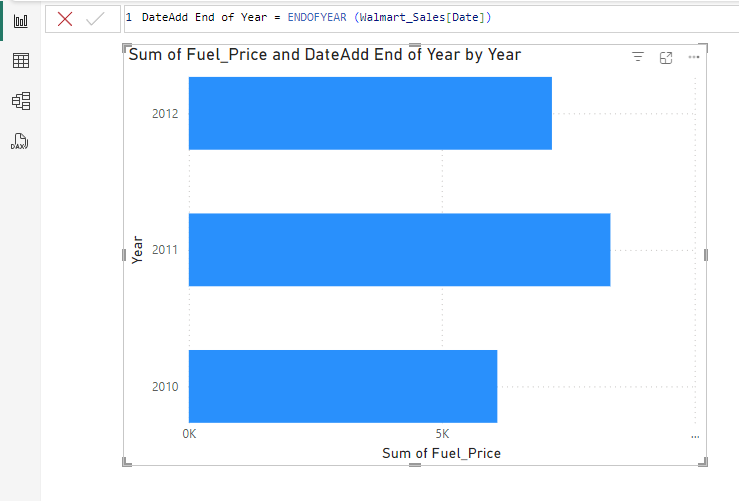
ENDOFYEAR(<dates> [,<year_end_date>]) = ENDOFYEAR (Sales [Date])
- Example:
=ENDOFYEAR(Walmart_Sales[Date])
ENDOFYEAR(Walmart_Sales[Date]): This provides the last date of the year for each date in the Walmart_Sales[Date] column.
For each date in the year 2024, the result will return on December 31, 2024.
Note:
It can be used when the year-end totals are to be calculated or data analysis needs to be done. This is mostly used in calculating and aggregating time-derived figures for financial reporting and year-end results analysis.

Note:
If you want to get the data used in this Blog, make sure to comment on this Blog so we can provide the data.
Now that you know the list of Time Intelligence functions in DAX, along with their descriptions, to help you perform advanced time-based calculations in Power BI we will move on to the Importance of Time Intelligence Functions
Importance of Time Intelligence Functions
Businesses frequently gauge the success of different campaigns over time to assess current changes and their importance. Typically, business stakeholders are curious about their key performance indicators (KPIs) and how they are doing in relation to their yearly goals.
They may want to examine the Year-to-date (YTD) profits, for instance, and how the discrepancy relates to the annual objective. Another metric to evaluate might be how much better or worse the results are than they were three months ago, last year, or last month. This will allow them to assess whether the business’s performance during the current year is comparable to that of a comparable period in the past year.
The functions in Power BI make such a comparison easier to apply because of the straightforward computations required. Although using pivot tables may be necessary, this is a simple method for calculating such time-based measures in Excel.
Common Time Intelligence Functions
Now, let’s examine the Common Time Intelligence Functions.
- TOTALYTD
The acronym TOTALYTD, which stands for Total Year-to-Date, determines the total amount accumulated from the start of the year until the designated date. It’s especially helpful for monitoring performance so far this year.
Syntax:
TOTALYTD(<expression>, <dates>[, <filter>][, <year_end_date>])
- Expression: The degree or calculation to total.
- Dates: The column with date values.
- Filter (optional): An additional filter to apply.
- year_end_date (optional): Allows specifying a custom fiscal year-end (default is December 31).
- TOTALQTD
TOTALQTD computes the cumulative total for a quarter up to the designated date, just like TOTALYTD does. It is useful for quarter-to-date analysis and stands for Total Quarter-to-Date.
Syntax:
TOTALQTD(<expression>, <dates>[, <filter>])
- Expression: The measure or calculation to sum.
- Dates: The column containing date values.
- Filter (optional): An additional filter to apply.
- TOTALMTD
TOTALMTD, or Total Month-to-Date, determines the cumulative total for the month up to the designated date. It is helpful for month-to-date analysis.
Syntax:
TOTALMTD(<expression>, <dates>[, <filter>])
- Expression: The measure or calculation to sum.
- Dates: The column containing date values.
- Filter (optional): An additional filter to apply.
Next up is a list of time intelligence functions, along with their names and descriptions.
A List of Time Intelligence Functions (Name and Description)
The DAX language incorporates functions that enhance the ability to perform time-based analysis. These functions serve the purpose of calculating values for a specific time interval, comparing intervals, and monitoring steady-state behavior. Below is a very detailed and exhaustive account of most of the useful functions:
1. CLOSINGBALANCEMONTH
The CLOSINGBALANCEMONTH() function in DAX for Power BI computes the value of the given expression also known as a measure, for the last date of the month which is in the scope of the predefined context of time.
Syntax:
CLOSINGBALANCEMONTH(<expression>, <dates>[, <filter>])
- expression: The measure or calculation to evaluate.
- dates: The column containing date values.
- filter (optional): An additional filter to apply.
Example :
=CLOSINGBALANCEMONTH(SUM(TransactionData[Revenue]),CalenderDate[Date])
- CLOSINGBALANCEMONTH: This function returns the value of this measure at the last Date in the month, which is within the current filter context.
- SUM(TransactionData[Revenue]): This function summarizes the Revenue column from the TransactionData table.
- CalendarDate[Date]: To ensure accurate calculations, the date column used must be from a properly configured Date Table.
Notes:
- Make sure this Date column is part of a continuous and marked Date Table in your data model.
- This measure can be used to show monthly closing balances in a table, matrix, or chart visual.
2. CLOSINGBALANCEQUARTER
The CLOSINGBALANCEQUARTER() function in DAX time intelligence—Power BI calculates its argument as of the last day of the most recently completed quarter, based on the current context.
Syntax :
CLOSINGBALANCEQUARTER(<expression>,<dates>[,<filter>])
- expression: The measure or calculation to evaluate.
- dates: The column containing date values.
- filter (optional): An additional filter to apply.
Example :
=CLOSINGBALANCEQUARTER(SUM(TransactionData[Revenue]),CalenderDate[Date])
- CLOSINGBALANCEQUARTER: Captures the value of a measure (i.e., the total revenue) on the last day of the current quarter.
- SUM(TransactionData[Revenue]): Sums the Revenue column from the TransactionData table.
- CalendarDate[Date]: The Date column has to belong to a valid and properly configured Date Table.
Notes:
- To get the correct results, make sure that the CalendarDate[Date] column is marked as a Date Table in Power BI before any query.
- Use this measure as a visualization to show quarter-closing balances, such as in a matrix or line chart.
3. CLOSINGBALANCEYEAR
CLOSINGBALANCEYEAR() is a time intelligence DAX function available in Power BI that computes the value of the expression at the last date in the year of the current context.
Syntax :
CLOSINGBALANCEYEAR(<expression>, <dates>[, <filter>])
- expression: The measure or calculation to evaluate.
- dates: The column containing date values.
- filter (optional): An additional filter to apply.
Example :
=CLOSINGBALANCEYEAR(SUM(TransactionData[Revenue]),CalenderDate[Date])
- CLOSINGBALANCEYEAR: This returns the measured value of a particular measure (e.g., total revenue) on its last Date defined within the current year.
- SUM(TransactionData[Revenue]): This function collects the Revenue column present in the TransactionData table.
- CalendarDate[Date]: The Date column is extracted from a valid Date Table, which is mandated for accurate time intelligence calculations.
Notes:
- Date Table: Make sure the CalendarDate[Date] column belongs to a properly marked Date Table in Power BI.
- Purpose: This measure could be used to mark the year’s close value in a table or matrix or visible in a bar or line chart.
4. OPENINGBALANCEQTR
In Power BI, the time intelligence DAX function OPENINGBALANCEMONTH() calculates a given expression as of the last day in the month just completed for applying the filters.
Syntax :
OPENINGBALANCEQUARTER(<expression>, <dates>[, <filter>])
- expression: The measure or calculation to evaluate.
- dates: The column containing date values.
- filter (optional): An additional filter to apply.
Example :
=OPENINGBALANCEMONTH(SUM(TransactionData[Revenue]),CalenderDate[Date])
- OPENINGBALANCEMONTH: This function returns the measured value for the first Date in the month within the filter context: in this case, it will return the total revenue.
- SUM(TransactionData[Revenue]): This is an aggregation of the Revenue column from the TransactionData table.
- CalendarDate[Date]: The Date column must come from a valid Date Table for calculation purposes.
Notes:
- Make sure that the CalendarDate[Date] column is part of a properly configured Date Table and fully marked in Power BI.
- It will present the monthly opening balances in reports and visuals such as tables or charts.
5 . OPENINGBALANCEQUARTER
The DAX function OPENINGBALANCEQUARTER(), used for time intelligence in Power BI, evaluates a given expression for the end date of the current period’s quarter filters, excluding the specified filters.
Syntax:
OPENINGBALANCEQUARTER(<expression>, <dates>[, <filter>])
- expression: The measure or calculation to evaluate.
- dates: The column containing date values.
- filter (optional): An additional filter to apply.
Example :
=OPENINGBALANCEQUARTER(SUM(TransactionData[Revenue]),CalenderDate[Date])
- REST of OPENINGBALANCEQUARTER: This function takes the value of the measure on the first date of the quarter within the current filter context (e.g., total revenue).
- SUM(TransactionData[Revenue]): This will take the Rewards column in TransactionData.
- The Date column must be from a valid Date Table to ensure proper time intelligence calculations.
Notes:
- Ensure that the CalendarDate[Date] column is part of a valid date table marked in Power BI.
- It will also be useful in reports and visuals for creating measures opening balances by quarter.
6 . OPENINGBALANCEYEAR
INTRODUCTION TO OPENINGBALANCEYEAR() FUNCTION IN DAX BY POWER BI: The Power BI time intelligence DAX function, OPENINGBALANCEYEAR(), Evaluates the specified expression for the date corresponding to the end of the previous year after applying specified filters.
Syntax :
OPENINGBALANCEYEAR(<expression>, <dates>[, <filter>])
- expression: The measure or calculation to evaluate.
- dates: The column containing date values.
- filter (optional): An additional filter to apply.
Example :
=OPENINGBALANCEYEAR(SUM(TransactionData[Revenue]),CalenderDate[Date])
- OPENINGBALANCEYEAR: It returns the value of that measure (like revenue) on the first Date of the year in the current filter context of the report.
- SUM(TransactionData[Revenue]): This means it sums the revenue column from the TransactionData table.
- CalendarDate[Date]: The Date column must be from the proper Date Table to calculate time intelligence accurately.
Notes:
- Make sure the CalendarDate[Date] column is from a valid Date Table marked in Power BI.
- This measure is typically used in reports or visuals to display opening balances at an annual frequency.
7. DATEADD
The DATEADD() function is a DAX time-intelligence function that is used in Power BI to create a table with a date column that can either be pushed forward or backward in time from the dates within the current context tableau and for a specified number of intervals.
Syntax
DATEADD(<dates>, <number_of_intervals>, <interval>)
- <dates> – A column containing dates.
- <number_of_intervals> – The number of intervals to shift (positive for future, negative for past).
- <interval> – The unit of time to shift, such as:
- DAY
- MONTH
- QUARTER
- YEAR
Example :
= CALCULATE([Total Sales],DATEADD(Dates[Date],-1,YEAR))
- CALCULATE: Settings make the calculation context suitable for time intelligence functions such as DATEADD.
- [Total Sales]: This would be a measure to calculate total sales (like SUM(TransactionData[Revenue])).
- DATEADD(Dates[Date], -1, YEAR): The DATEADD function actually shifts the Date by one year back:
- Dates[Date]: This one refers to the Date column from your Date Table; be sure it is marked as Date Table.
- -1: Moving a year back.
- Year: The granularity of change is one year.
Notes:
- The dates table is correctly configured and marked Date Table.
- This formula calculates the sales for the same period last year and hence is used for comparisons or YoY (Year-on-Year) growth calculations.
8 . DATES BETWEEN
One of the functions used in time intelligence in Power BI DAX is known as DATESBETWEEN (), it provides the set of dates which are falling between the two dates that are provided.
Syntax :
DATESBETWEEN(<dates>, <start_date>, <end_date>)
- <dates> – A column with date values (typically from a date table).
- <start_date> – The beginning of the date range.
- <end_date> – The end of the date range.
Example :
= CALCULATE (
SUM (Sales[Sales Amount]), DATESBETWEEN (Sales[Date], DATE (2015,1,1), DATE (2015,3,31))
)
- CALCULATE: Modifies the context in which the calculation is applied according to the arguments in the second one.
- SUM(Sales[Sales Amount]): The total sales amount in the Sales table.
- DATES BETWEEN(Sales[Date], DATE(2015, 1, 1), DATE(2015, 3, 31)): In fact, limits the Sales[Date] column to only those days between 1 January 2015 and 31 March 2015
- Sales[Date]: This column shows the Date of the Sales table.
- DATE(2015, 1, 1) and DATE(2015, 3, 31): These are the minimum and maximum dates from the range, respectively.
Note:
- Ensure Sales[Date] is fitted from a proper Date Table when doing time-related calculations.
- This measure can also be useful in cases where total sales values are required for any arbitrary date range, such as quarters or user-defined periods.
9. DATESINPERIOD
The DAX function DATESINPERIOD() serves time intelligence purposes in Power BI and creates a table with one date column starting at the specified start_date and extending for the number_of_intervals.
Syntax :
DATESINPERIOD(<dates>, <start_date>, <number_of_intervals>, <interval>)
- <dates> – A column with date values (typically from a date table).
- <start_date> – The reference date (usually MAX(Date[Date]) for the latest date).
- <number_of_intervals> – The number of intervals to include (negative for past, positive for future).
- <interval> – The unit of time to consider:
- DAY
- MONTH
- QUARTER
- YEAR
Example :
= CALCULATE (
SUM (Sales [Sales Amount]),
DATESINPERIOD (Sales[Date], DATE (2015,1,1),3, MONTH)
)
- CALCULATE: Places the calculation in the context of filters
- SUM(Sales[Sales Amount]): Sum of the Sales Amount column in the Sales table.
- DATESINPERIOD(Sales[Date], DATE(2015, 1, 1), 3, MONTH): Filters the Sales[Date] column from January 1, 2015, for 3 months:
- Sales[Date]: Represents the date column in the Sales table.
- DATE(2015, 1, 1): Starts the period.
- 3: Represents the number of months.
- MONTH: Represents the unit of time (3 months in this case).
Note:
- This formula allows the calculation of sales starting from January 1, 2015, for 3 months, meaning up to March 31, 2015.
- This metric is useful for calculating the sales over a dynamic time, for example, rolling 3-month periods.
10 . DATESMTD
In Power BI, the DAX expression DATESMTD() is a time-based intelligence function that returns a table containing one column of the dates for the current month upto the current date within the existing filter context.
Syntax :
DATESMTD(<dates>)
- <dates> – A column with date values (typically from a date table).
Example :
= CALCULATE (
SUM (Sales [Sales Amount]), DATESMTD (Sales [Date])
)
- CALCULATE: Modifies the filter context under which this sum is calculated.
- SUM(Sales[Sales Amount]): Sums the Sales Amount column from the Sales table.
- DATESMTD(Sales[Date]): This function filters the Sales[Date] column to select only the date range, starting from the month to the current Date. It is a time intelligence function that adjusts itself according to the readings about this month’s days.
- Sales[Date]-The Date column from the Sales table.
- DATESMTD functions in the context of the Current Date.
Note:
- Month-to-date MTD will capture sales for the current month until the last Date available on the filter context, including the sales for that Date.
- The Sales[Date] column must be related to a Date Table to get proper time intelligence calculations.
- This measure could be used in report/dashboard scenarios, showing sales until that Date in the month.
11 . DATESQTD
This function is found in the time intelligence section of the DAX functions in Power BI. The DATESQTD() function generates a table with one column containing a list of dates of the active quarter, as per the current context.
Syntax :
DATESQTD(<dates>)
<dates> – A column containing date values (typically from a date table).
Example :
= CALCULATE (
SUM (Sales [Sales Amount]), DATESQTD (Sales [Date])
)
- Calculation: OVERWRITE: This is how the function alters the context within which the data would be analyzed as per the assigned filters.
- SUM(Sales[Sales Amount]): The sum of Sales Amount from the Sales table.
- DATESQTD(Sales[Date]): This filters out the dates from the date of beginning to today’s date in the Sales[Date] column as follows:
- –Sales[Date]: It is the definite column from the Sales table.
- – DATESQTD is a time intelligence function that is automatically updated to the current quarter.
Notes:
- Quarter-to-date (QTD) gives the total sum of sales from the beginning of the current quarter to the most recent date in the filter context.
- – Be sure to have Sales[Date] as part of a Date Table for proper time intelligence to work.
- This measure informs you of the sales performance during the current quarter up till today’s date.
12 . DATESYTD
The DAX function found in Power BI called DATESYTD is a time intelligence function that provides a table that includes all the dates between the start of the financial year and the maximum date in the data model.
Syntax :
DATESYTD(<dates>, [year_end_date])
- <dates> – A column with date values (typically from a date table).
- [year_end_date] (optional) – The fiscal year-end date (default is December 31)
Example :
= CALCULATE(SUM(Sales [Sales Amount]), DATESYTD(sales[Date]))
- CALCULATE Changes the filter context for the summation calculation.
- SUM(Sales[Sales Amount]): Sums the Sales Amount column from the Sales table.
- DATESYTD(Sales[Date]): Filters the Sales[Date] column to only include dates from the beginning of the current year to this Date. A time intelligence function that defines this based on the current year:
- Sales[Date]: The Date from the Sales table.
- DATESYTD returns dates from the beginning of the year running up to the most current Date from the filter context.
Notes:
- Year-to-date (YTD) will, therefore, give the total sales from the current year to the date that is the most up-to-date date available in the filter context.
- For time intelligence calculations to work properly, the Sales [Date] column must be part of a data table.
- This measure would be useful for reporting sales performance from the start of the year until this point in the year.
13 . ENDOFMONTH
The END OF MONTH () DAX function from the time intelligence function in Power BI functionality takes the last day of the relevant current column month with respect to the dates hierarchy in the current context.
Syntax :
ENDOFMONTH(<dates>)
- <dates> – A column with date values (typically from a date table)
Example :
= END OF MONTH (Sales [Date])
- END OF MONTH (Sales[Date]): This returns the end date for each date listed in the column Sales[Date]. Thus, if it occurs on March 15, 2025, the end of the month returns the value.
- For instance, March ends on the last day of that month, March 31, 2025
Note:
- The function is extremely useful when you want to summarize data at the end of the month or when performing calculations that rely on the very last day of the month.
14 . ENDOFQUARTER
The Power BI time intelligence DAX function ENDOFQUARTER() returns the last date of the quarter in the current context for the specified column of dates.
Syntax :
ENDOFQUARTER(<dates>)
- <dates> – A column with date values (typically from a date table)
Example :
= ENDOFQUARTER (Sales [Date])
- END OF QUARTER (Sales[Date]): This gives the last date of the quarter corresponding to each date in the Sales[Date] column.
- For example, if the date is March 15, 2025, the output will be March 31, 2025 (end of Q1). If it is July 10, 2025, it will return on June 30, 2025 (end of Q2).
Note:
- It is useful when people have to calculate something, like quarter-end totals, or summarise data for the end of each quarter in their reports or dashboards.
15. END OF YEAR
The Power BI time intelligence DAX feature ENDOFYEAR() returns the final date of the current context’s year in given column of dates.
Syntax :
ENDOFYEAR(<dates>, [year_end_date])
- <dates> – A column with date values (typically from a date table).
- [year_end_date] (optional) – The fiscal year-end date (default is December 31).
Example:
=ENDOFYEAR(Walmart_Sales[Date])
- ENDOFYEAR(Walmart_Sales[Date]): This provides the last date of the year for each date in the Walmart_Sales[Date] column.
- For each date in the year 2025, the result will return on December 31, 2025.
Note:
- It can be used when the year-end totals are to be calculated or data analysis needs to be done. This is mostly used in calculating and aggregating time-derived figures for financial reporting and year-end results analysis.
Now, we’ll see how working with DAX in Power BI goes.
Now, we will examine the process of working with DAX in Power BI to create powerful calculations and unlock advanced data insights.
Working with DAX in Power BI
Let’s utilize the button labeled “Import Data from Microsoft Excel Workbook” to load the data in Power BI. The imported data, as seen in the data view of Power BI


We’ll use the “New Measure” to compute a column. To accomplish this, we’ll use our first Data Analysis Expression (DAX), a formula similar to Excel that can generate new columns in the data.
From the “Data,” Power BI’s Count function generates a column with the Count of Order columns. However, dates from the DATASET are represented in the “Count of Order” column. Making a new table with a string of continuous dates is a simpler method of taking advantage of Power BI’s Time Intelligence features, though it might be easier.
Before diving deeper, the next step is to create a Date reference table, a critical component for enabling accurate time-based calculations
Creating a Date reference table
With regard to the advancement of the Data Model, a new table needs to be created. This can be achieved by moving to the “Home” tab and Click “New Table” button.


Once the “count of order” table has been created, we have to mark this table as the official Count of order Table in our Data Model. That can be done by finding the “Date” table in the “Fields” pane on the right and clicking on “Count of order.” Power BI will ask you to select the column that represents the date. By now, you know it is the “Count of order” column.
Unless we create a relationship between the “Walmart_Sales” table and the “data_sales(1)” table, we can’t use the created table for DAX calculations. To achieve this, we go to the Relationship view of the model and establish a one-to-many relationship between the “Weekly_sales ” column of the “Walmart_sales” table and the “Total Sales” column of the “data_sales(1)” table.
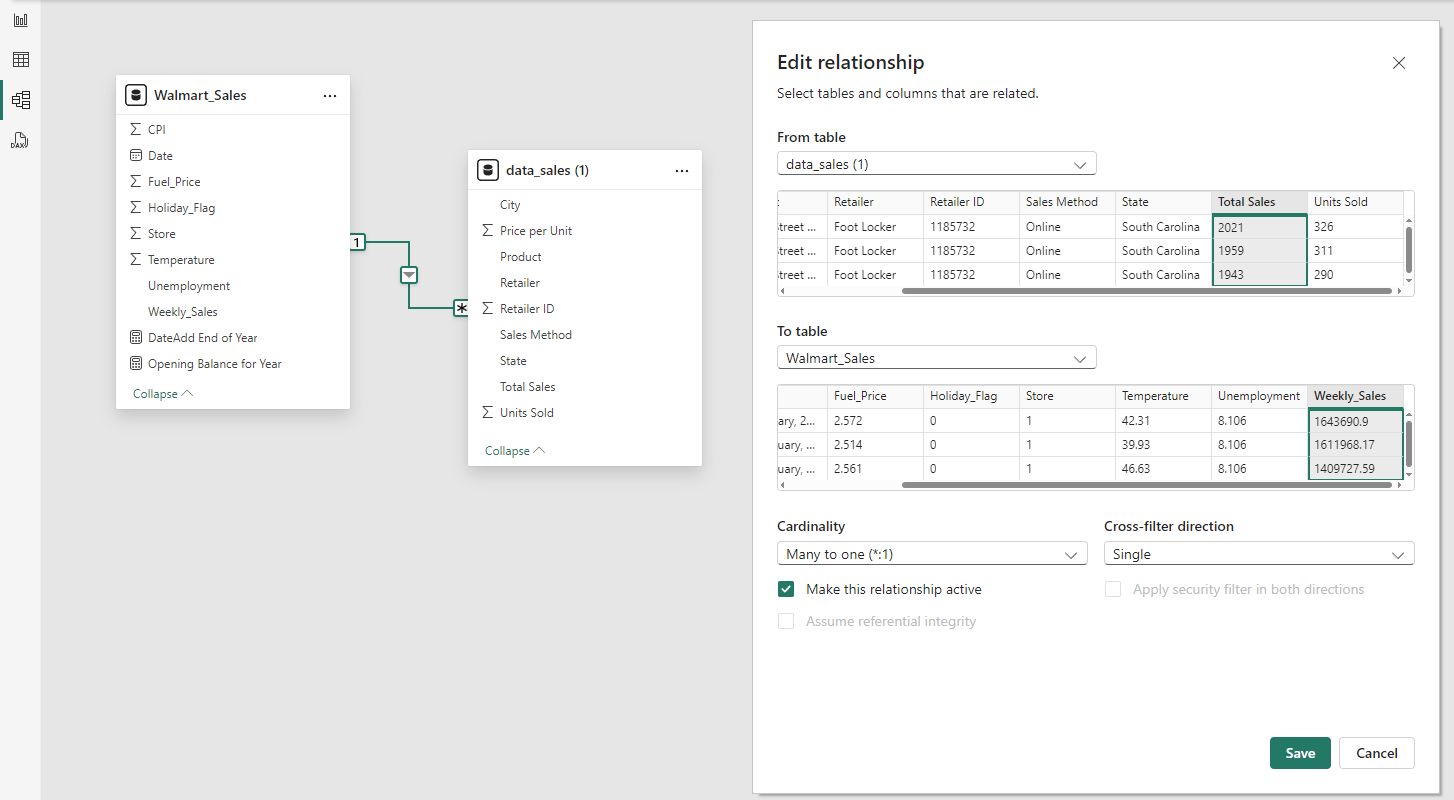

With the Date reference table in place, we’ll now define calculated columns and measures required for advanced Time Intelligence operations.
Requisite Calculated Columns and Measures
The Requisite Calculated Columns and Measures are based on DAX-based calculations, which are important in enhancing the Power BI reports that are also in motion. Usually, these are accustomed to the dataset and the reporting objectives, which include temporal reasoning, Key Performance Indicators (KPIs), and other derived insights.
1. Calculated Columns:
- Year-Month: Combines year and month for grouping.
Year-Month = FORMAT(Dates[Date], "YYYY-MM")
- Fiscal Year: Adjusts the year based on the fiscal start month.
Fiscal Year = IF(MONTH(Dates[Date]) >= 4, YEAR(Dates[Date]), YEAR(Dates[Date]) - 1)
- Week Number: Week number based on your business rules.
Week Number = WEEKNUM(Dates[Date], 2) -- Week starts on Monday
- Quarter Name: Identifies the quarter for reporting.
Quarter = "Q" & FORMAT(Dates[Date], "Q")
- IsHoliday: Flags holidays for filtering and analysis.
IsHoliday = IF(Dates[Date] IN {DATE(2024, 12, 25), DATE(2024, 1, 1)}, TRUE(), FALSE())
2. Measures:
- Total Sales: Aggregates sales data.
Total Sales = SUM(Sales[Amount])
- Year-to-Date Sales (YTD): Calculates cumulative sales for the year.
YTD Sales = TOTALYTD(SUM(Sales[Amount]), Dates[Date])
- Previous Year Sales: Compares current sales with the previous year.
Previous Year Sales = CALCULATE(SUM(Sales[Amount]), SAMEPERIODLASTYEAR(Dates[Date]))
- Rolling 3-Month Average: Tracks trends over the last three months.
Rolling 3-Month Avg = AVERAGEX(DATESINPERIOD(Dates[Date], LASTDATE(Dates[Date]), -3, MONTH), [Total Sales])
- Sales Growth Percentage: Measures year-over-year growth.
Sales Growth % = DIVIDE([Total Sales] - [Previous Year Sales], [Previous Year Sales], 0)
Hence, these metrics and calculated columns now set the groundwork for organizing Dynamic and Beautiful Reports in Power BI.
Next, we’ll bring everything together by using Time Intelligence functions to analyze and visualize business performance effectively
Analyzing business performance with Time Intelligence functions in Power BI
The measure created in the last section can be viewed in the “Report” view of the data model using a table and a chart. This gives us a view of the YTD year-by-month comparison of Sales YTD.
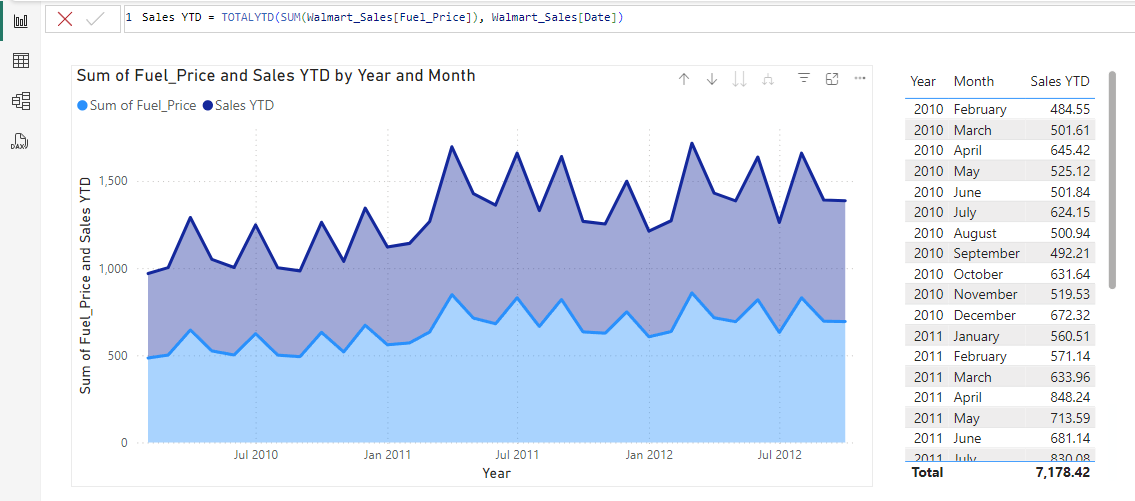

One of the most widely used business KPIs is Year-to-Date (YTD) values. Year-to-date shows the cumulative performance metrics (Sales YTD) starting from the beginning of the year until the selected date. We will use the TOTALYTD function in Power BI to calculate the Sales YTD numbers.
To create the YTD view of Sales YTD, we will create a new measure using the following formula.
![]()

Another, most commonly used time intelligence function in Power BI is SAMEPERIODLASTYEAR. It evaluates the business performance of the current period against the same period the previous year.

Wrapping up, we’ll summarize the key takeaways from this guide on Time Intelligence functions and their applications in Power BI
Conclusion
We discovered the importance of time intelligence in evaluating business performance in this blog. We also looked at a real-world example of using Power BI to determine the year-to-date numbers for a specific KPI.
The performance of a business can be reported with the help of Power BI’s numerous time intelligence features. Additionally, we can define measures in Power BI, unlike Excel calculations that are based on individual cells. Measures are capable of performing real-time calculations at any level of detail.
Finally, we’ll address some frequently asked questions to clarify doubts and ensure a solid understanding of Time Intelligence in Power BI
Time Intelligence Functions in Power BI FAQS
1. What are Time Intelligence functions in Power BI?
In Power BI, Time Intelligence refers to the DAX functions that allow easy calculations across dates, such as year-to-date, month-to-date, and period comparisons. A well-structured data table is needed to carry out such analysis on trends or performance over time.
Examples of such functions include TOTALYTD, PREVIOUSYEAR, and DATESBETWEEN.
2. Why is a Date Table essential for Time Intelligence in Power BI?
A Date Table supplies an uninterrupted sequence of dates that are needed for the execution of Time Intelligence features. It should have certain columns such as Year, Month, Quarter, and Weekday Row. Besides, this table should be designated as a ‘Date Table’ in Power BI and connected networks to fact tables. In the absence of a Date Table, Time Intelligence computations may prove incorrect or may be impossible to perform.
3. What are the common Time Intelligence functions used in Power BI?
- TOTALYTD: Cumulative total year-to-date.
Sales YTD = TOTALYTD(SUM(Sales[Amount]), Date[Date]) - SAMEPERIODLASTYEAR: Compares metrics to the same period in the previous year.
Sales LY = CALCULATE(SUM(Sales[Amount]), SAMEPERIODLASTYEAR(Date[Date])) - DATESINPERIOD: Calculates over a rolling time window (e.g., 3 months).
Rolling Sales = SUMX(DATESINPERIOD(Date[Date], MAX(Date[Date]), -3, MONTH), [Sales])
This concludes the discussion of Power BI’s Time Intelligence features. From YTD computations to rolling averages and period comparisons, these functions enable dynamic, perceptive time analysis.
Gaining access to the full Power BI features in Time Intelligence through advanced learning and training programs could be beneficial, and mastering these features will open up an overload of opportunities for improving analytical capabilities. Delivering data-driven impact requires a thorough understanding and mastery of these functions. We recommend you take up the Power BI Certification Training offered by Edureka. Edureka’s Power BI certification course by PwC offers dual certification in business intelligence. The training is live instructor-led and provides hands-on experience in real-time projects. It prepares you for the official PL-300 exam and offers simulated real-world scenarios.
Do you have any questions or need further information? Feel free to leave a comment below, and we’ll respond as soon as possible!