


Best Power BI Training Courses by PwC Academy
- 102k Enrolled Learners
- Weekend/Weekday
- Live Class
(33100)


 Copy Link!
Imagine a large retail company struggling with slow report performance in Power BI. Their dataset, containing sales, inventory, and customer data, was structured as a flat table with millions of records. Query performance was sluggish, and filtering data took several minutes. After restructuring their data model into a star schema, they noticed a dramatic improvement in Power BI’s performance, making reports load faster and enhancing user experience. This transformation perfectly explains why understanding and implementing the star schema is essential for Power BI users.
A star schema is a widely used database design pattern for organizing data to optimize performance for reporting and analytics. It consists of:
The structure resembles a star, with the fact table at the center and dimension tables branching out, which is how it gets its name.
You now understand what a star schema is. Next, we’ll examine the significance of the star schema for Power BI.
A properly designed star schema reduces data redundancy and enhances query performance. Power BI’s VertiPaq engine is optimized for columnar storage, and having well-structured fact and dimension tables leads to better compression and faster data retrieval.
In Power BI, relationships between tables are critical for accurate analysis. A star schema simplifies these relationships, making it easier to create measures using DAX (Data Analysis Expressions) and avoiding complex many-to-many relationships or circular dependencies.
As data grows, maintaining a star schema structure makes it easier to scale. Changes, such as adding new product categories or customer attributes, can be handled efficiently by modifying dimension tables without affecting the entire model.
Next, we’ll look at an example: Using Power BI to Implement Star Schema
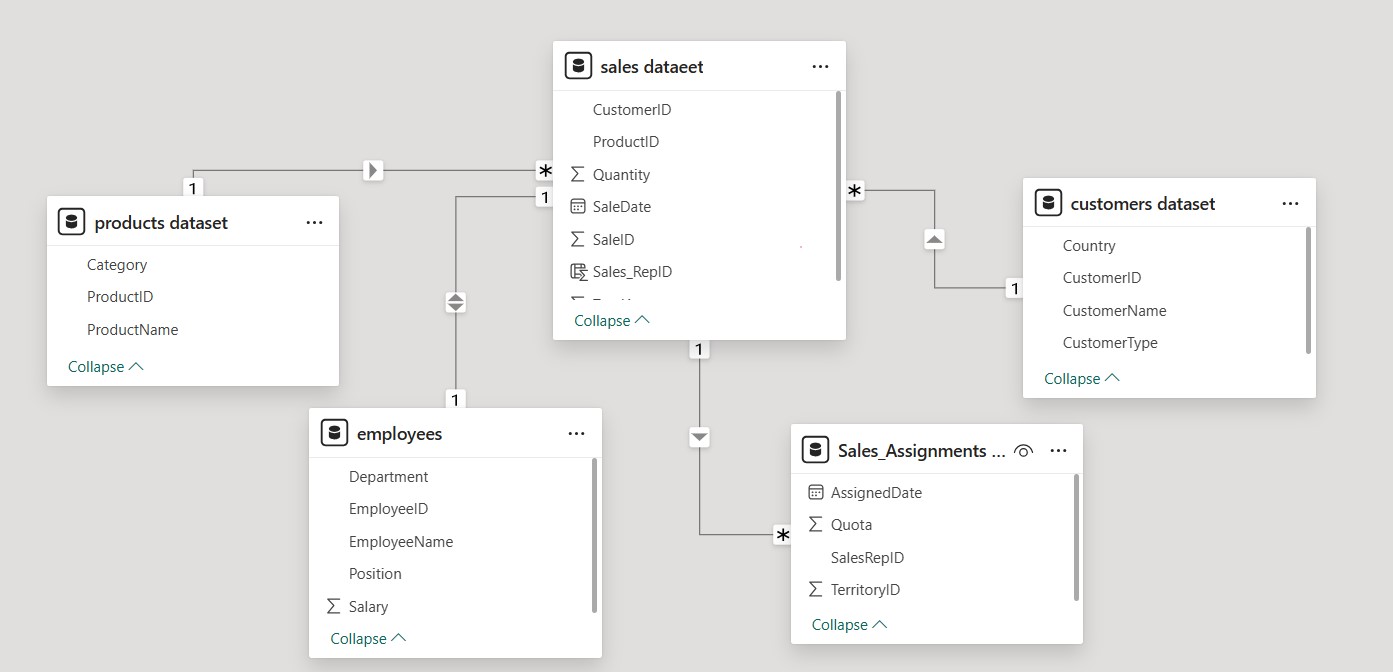
This image represents a star schema data model in Power BI, which is optimized for analytical reporting. Let’s break it down:
sales dataset (Central Table)CustomerID, ProductID, Quantity, SaleDate, SaleID, and Sales_RepID.Products dataset (Product Dimension)Category, ProductID, and ProductName.sales dataset via ProductID.Customers dataset (Customer Dimension)CustomerID, CustomerName, Country, and CustomerType.sales dataset through CustomerID.Employees (Employee Dimension)EmployeeID, EmployeeName, Department, Position, and Salary.Sales_RepID).Sales_Assignments (Sales Territory & Quota)SalesRepID, TerritoryID, Quota, and AssignedDate.sales dataset) is at the center and connects to multiple dimension tables using one-to-many relationships (1:*).ProductID, CustomerID, Sales_RepID) link to primary keys in dimension tables.Next, we’ll examine how this model’s star schema functions.
Efficient Joins:
Simplified Aggregation:
sales dataset with products dataset.sales dataset with employees.Flexible Filtering & Drill-Downs:
We’ll examine why this star schema is perfect for Power BI next.
SUM(Quantity) or COUNT(SalesID) are straightforward.Finally, we reached the Conclusion.
A star schema is the foundation of an optimized Power BI data model, providing better performance, easier relationships, and improved scalability. By implementing this structure, businesses can unlock faster analytics, improved query efficiency, and a more manageable data model. Whether working with small datasets or enterprise-level reporting, using a star schema will significantly enhance your Power BI experience.
The blog covers the Star Schema in Power BI and its impact on improving query performance, as well as reducing troubleshooting complexity in data modeling. Here, the benefits of using fact and dimension tables for a scalable and efficient design are described. Though a Star Schema ensures better reporting in Power BI, proper implementation is critical for maximizing performance and usability.
If you’re looking to advance your Power BI skills and career opportunities, consider enrolling in the Power BI Certification Training Course by Edureka. This program, designed in collaboration with PwC, provides dual certification in Business Intelligence and prepares you for the PL-300 certification exam. With live instructor-led sessions, hands-on real-world projects, and simulated business scenarios, this training ensures you gain practical expertise in Power BI
Do you have any questions or need further information? Feel free to leave a comment below, and we’ll respond as soon as possible!


 Thank you for registering Join Edureka Meetup community for 100+ Free Webinars each month JOIN MEETUP GROUP


