PySpark Certification Training Course
- 12k Enrolled Learners
- Weekend/Weekday
- Live Class
In this blog, I am going to talk about one of the most trending analytical tool Splunk, which is winning hearts in the fields of big data and operational intelligence. It is a horizontal technology used for application management, security and compliance, as well as business and Web analytics, with tremendous market demand for professionals with Splunk Certification Training. Splunk is a complete solution which helps in searching, analyzing and visualizing the log generated from different machines. Through this Splunk tutorial, I will introduce you to each aspect of Splunk and help you understand how everything fits together to gain insights from it.
But before I start, let me list down the topics that I will be discussing:
Before getting started with Splunk, have you ever realized the challenges with unstructured data and the logs coming in real-time? For example- live customers queries, increased number of logs through which the size of the dataset keeps on fluctuating every minute. How can all of these problems be tacked? Here, Splunk comes to the rescue.
Splunk is a one-stop solution as it automatically pulls data from various sources and accepts data in any format such as .csv, json, config files, etc. Also, Splunk is the easiest tool to install and allows functionality like: searching, analyzing, reporting as well as visualizing machine data. It has a huge market in the IT infrastructure and business. Many big players in the industry are using Splunk such as Dominos, Adobe, Bosch, Vodafone, Coca-Cola etc.
As you can see in the above image, Splunk has some really cool advantages:
Moving ahead in Splunk tutorial, let’s understand how things work internally.
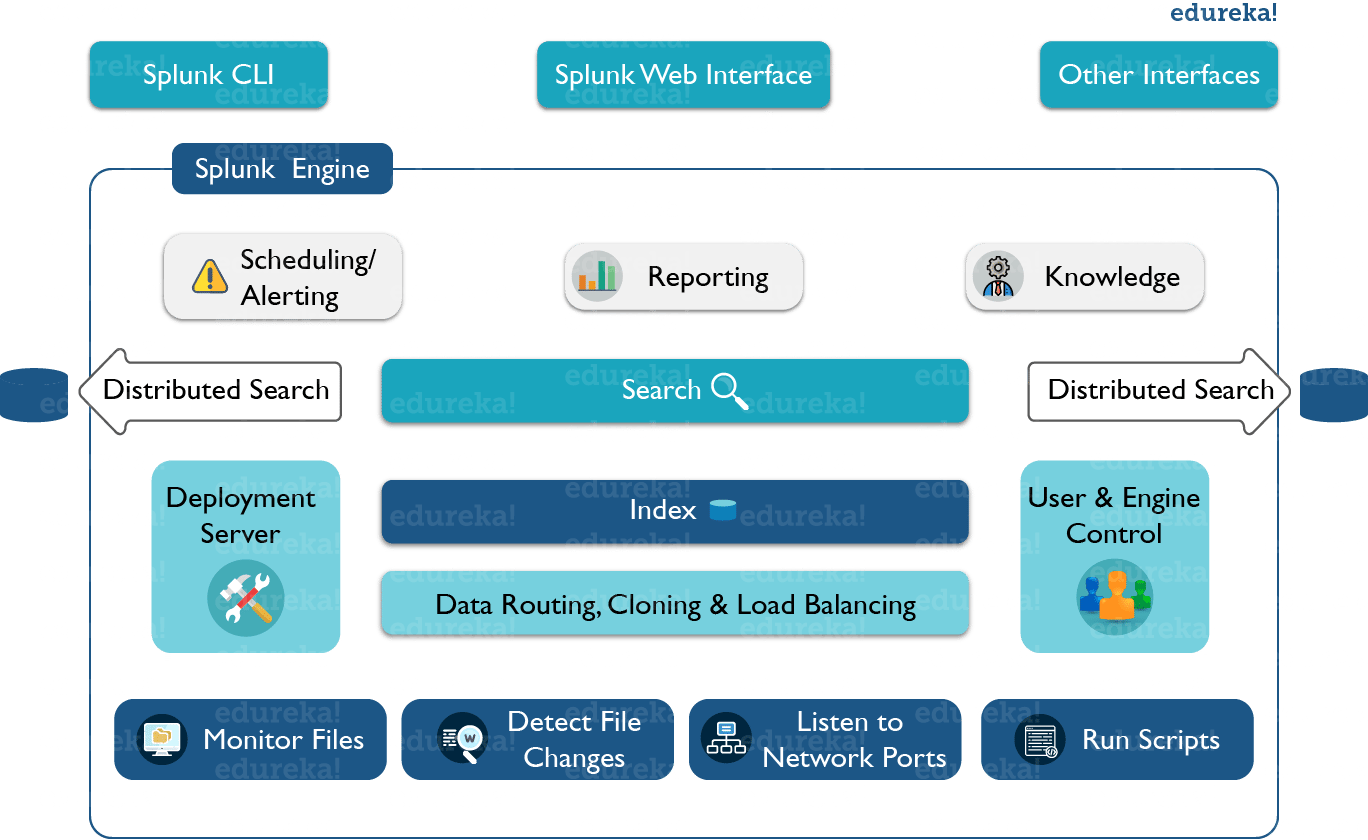
Splunk’s architecture comprises of various components and its functionalities. Refer to the below image which gives a consolidated view of the components involved in the process:
As you can see in the above image, splunk CLI/ splunk web interface or any other interface interacts with the search head. This communication happens via Rest API. You can then use search head to make distributed searches, setup knowledge objects for operational intelligence, perform scheduling/ alerting and create reports or dashboards for visualization. You can also run scripts for automating data forwarding from remote Splunk forwarders to pre-defined network ports. After that you can monitor the files that are coming at real time and analyze if there are any anomalies and set alert/ reminders accordingly. You can also perform routing, cloning and load balancing of the data that is coming in from the forwarder, before they are stored in an indexer. You can also create multiple users to perform various operations on the indexed data.
While indexing the data, the first question that will arise is “How much will it cost?”. Well, it all depends on the volume that you are indexing. So, in a nutshell:
There are major two Splunk editions:
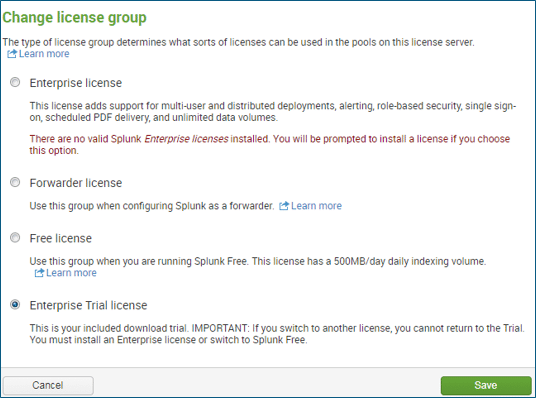
We have different types of licenses, refer to the below screenshot.

Next, let us move ahead in Splunk tutorial and understand the configuration files.
Configuration files play a very important role in the functioning of your Splunk environment. These configuration files contain Splunk system settings, configuration settings and app configuration settings. You can edit these files and accordingly changes will be reflected in your Splunk environment. However, the changes made to configuration files will be taken into effect only if the Splunk instance is restarted.
These configuration files can be found in the below places:
Path where these configuration files are stored is consistent in all operating systems. They are always stored in $SPLUNK_HOME, the directory where Splunk is installed.There is another path where configuration files are stored: $SPLUNK_HOME/etc/users. In this folder, user specific settings in UI, user specific configurations and preference will be stored. As an administrator you can also store user specific settings for multiple Splunk users.
Everything you see in the UI is configurable/ modifiable via the configuration file. In fact there are a lot of options that cannot be edited via UI, but it is possible via CLI or by directly editing a configuration file. Moving ahead in splunk tutorial,let us know discuss the structure of these conf files.
Configuration File Structure
[stanza1]
<attr1> = <value>
<attr2> = <value>
For example:
[SSL]
serverCert = <pathname>
password = <password>
In the last section of this Splunk tutorial blog, I will talk about the most common configuration files in Splunk:
That brings us to the end of this Splunk tutorial blog. I am pretty sure that by now, most of you have understood the fundamentals of Splunk, so you can start indexing data and gain insights from it.
 Thank you for registering Join Edureka Meetup community for 100+ Free Webinars each month JOIN MEETUP GROUP
edureka.co