


Best Power BI Training Courses by PwC Academy
- 102k Enrolled Learners
- Weekend/Weekday
- Live Class
(33100)


 Copy Link!
In the world of data visualization, interactivity is essential for gaining deeper insights. Imagine being able to dynamically filter your reports with a single click, fine-tuning your analysis in real-time. This is where Power BI slicers come into play—a game changer that turns static reports into highly interactive dashboards. Whether you’re looking at sales trends, customer behavior, or financial metrics, slicers make it easy to drill down into the most important data. In this guide, we will look at the various types of slicers, how to create and format them, and best practices for their use.
Imagine you’re analyzing sales data in Power BI and want to filter reports dynamically by region, product category, or period. Instead of manually applying filters in each visual, Slicers allow you to interactively select the required data, updating all visuals in real-time. This improves usability, speeds up analysis, and provides better insights.
After you’ve grasped the example, let’s examine what Power BI slicers are.
In Power BI, slicers are visual components that serve as on-page filters. Slicers, in contrast to conventional filters, are positioned directly on the report canvas, facilitating user interaction with the data. They are especially useful in scenarios where quick, user-friendly filtering is required.
Principal Advantages of Slicers:
We’ll now discuss the purpose of slicers.
Slicers in Power BI are used to create interactive dashboards by allowing users to filter data dynamically. They provide a user-friendly way to refine reports, offering better visibility of applied filters and improving data exploration. With different types like lists, dropdowns, and date range slicers, they make reports more intuitive and enhance decision-making.
Let’s examine the various Power BI slicer types.
After that, we’ll look at How to Make a Slicer in Power BI.
Open Power BI Desktop and navigate to the report canvas.
Bar Chart (“Sales by Quantity”)
x-axis (Quantity) represents the number of units sold. y-axis (Sum of Sales) represents the total sales value.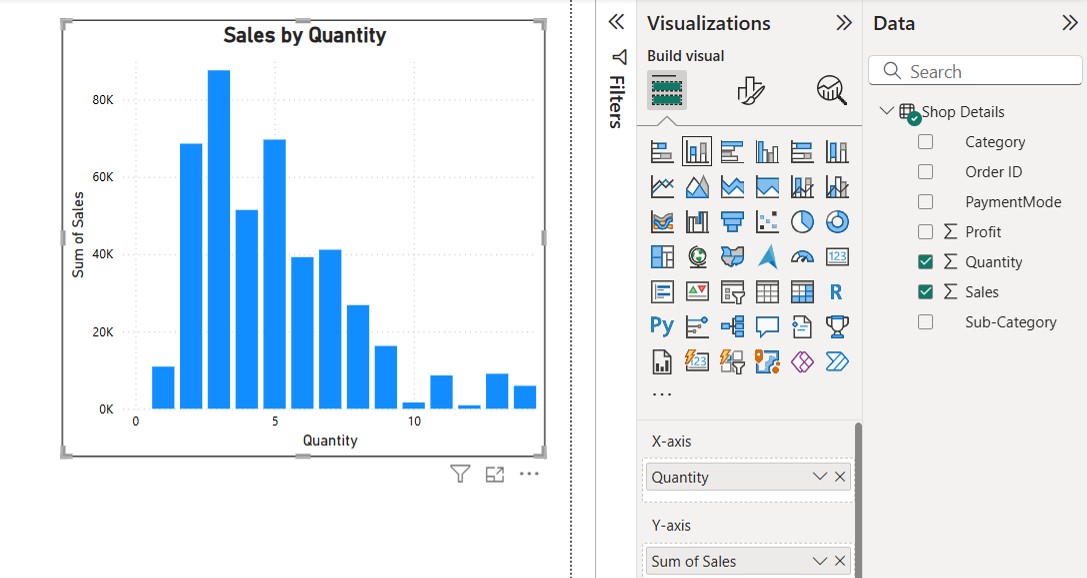
Select the Slicer Visual from the Visualizations pane
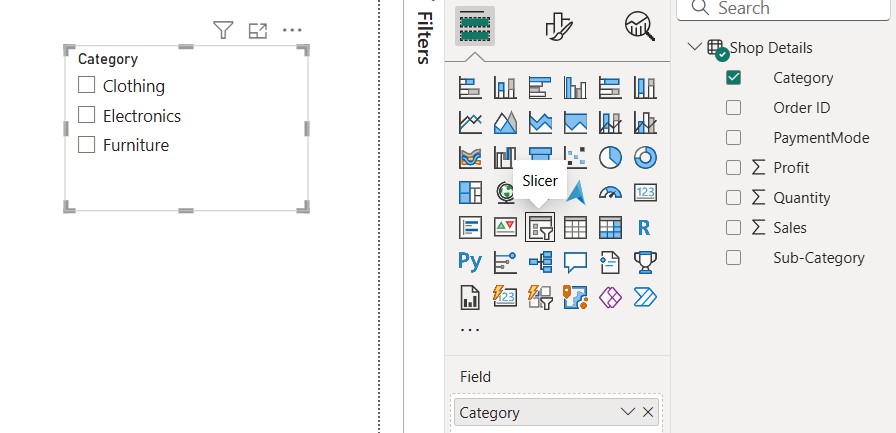
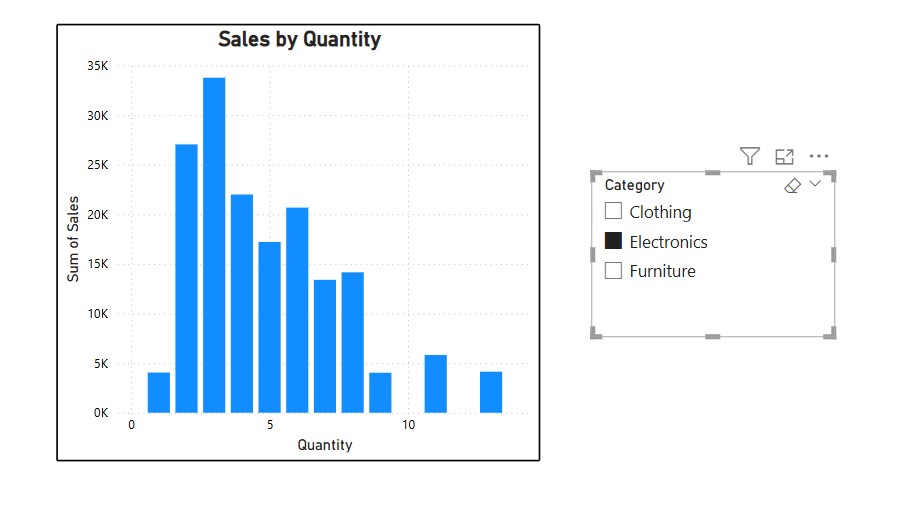
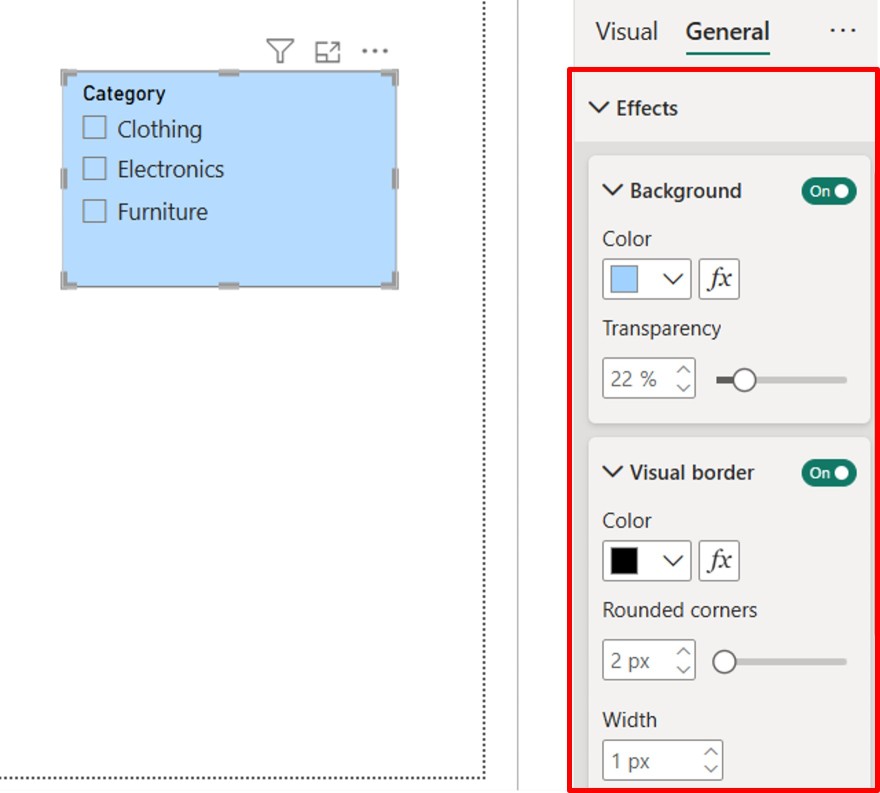
Category Slicer
With the help of the slicer settings, you can also alter the slicer’s type. Below that, you’ll find an option to switch between tile, dropdown, and vertical list.
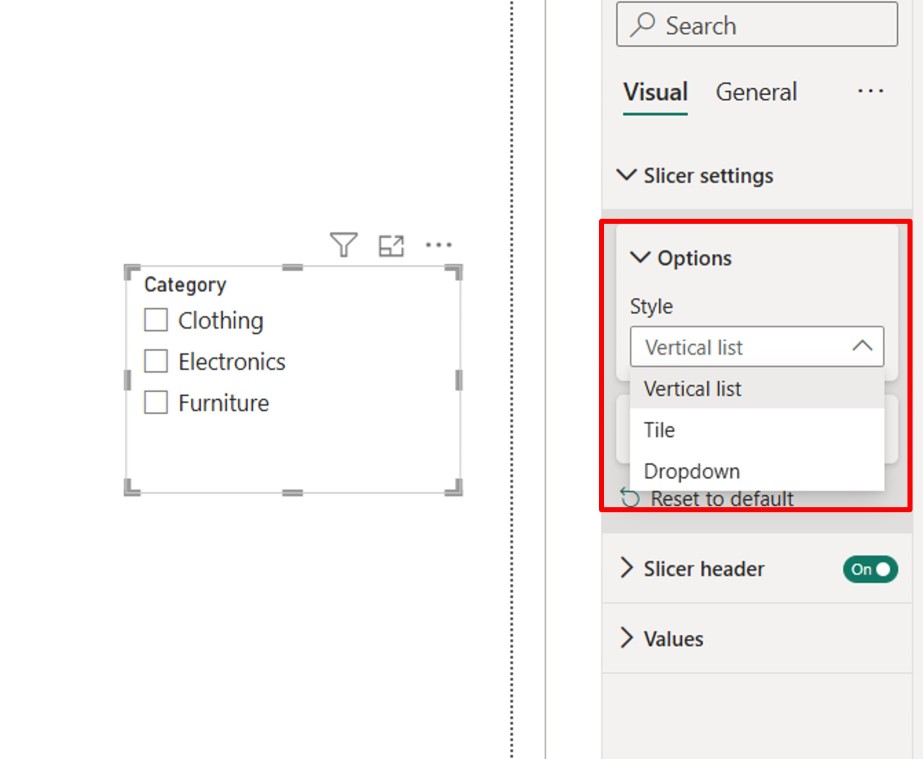
Along with a visually appealing background in the general area, you can also use a background color to alter the slicer background color.
We will now examine the limitations of Slicers and compare them to the best practices for using them in Power BI.
While slicers are useful, they have some limitations:
To optimize slicer performance and usability:
Lastly, we’ll look at the conclusion.
Slicers in Power BI significantly enhance report interactivity by enabling easy data filtering. By using the right type of slicers, formatting them effectively, and managing their interactions, you can create a seamless user experience. Mastering slicers will allow you to build more dynamic and user-friendly Power BI reports.
The blog covers Slicers in Power BI and their role in enhancing interactivity and user-driven data exploration. It explains how slicers act as on-page filters, allowing users to refine reports dynamically with a simple selection. The benefits of different slicer types, such as list, dropdown, and range slicers, are discussed to help create a more intuitive and efficient reporting experience. While slicers improve usability and data analysis, proper implementation is crucial to maintaining report performance and clarity.
If you want to advance your Power BI skills and career opportunities, consider enrolling in the Power BI Course: PwC Academy by Edureka. This program, designed in collaboration with PwC, provides dual certification in Business Intelligence and prepares you for the PL-300 certification exam. With live instructor-led sessions, hands-on real-world projects, and simulated business scenarios, this training ensures you gain practical expertise in Power BI
Do you have any questions or need further information? Feel free to leave a comment below, and we’ll respond as soon as possible!


 Thank you for registering Join Edureka Meetup community for 100+ Free Webinars each month JOIN MEETUP GROUP


