Power BI Certification Training Course: PwC A ...
- 101k Enrolled Learners
- Weekend/Weekday
- Live Class
When creating or editing a report, you can use many different types of Power BI visuals. The article ahead focuses on these visuals which help you create live and interactive reports and dashboards on Power BI.
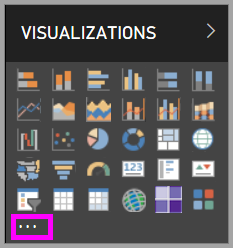
These visuals come pre-installed as a package when you download the Power BI Software and the icons for these visuals appear in the Visualization pane as shown below.
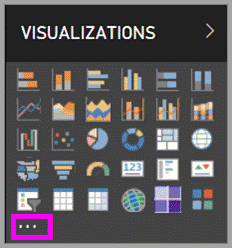
But these visuals are not what you are limited to. Selecting the option of the ellipses(…) at the bottom of the pane enables another source of visuals to become available –Power BI visuals.
Power BI Developers create these visuals using the Power BI SDK. These visualizations enable business users to see their data from the perception of their business. Reports can then be imported with custom visual files which, then, can be filtered, highlighted, edited, shared, etc.
Visuals in Power BI are deployed in the following ways:
Power BI visuals, basically, are packages that include code for rendering the data served to them. Anybody can build a Power BI custom visual and package it as .pbiviza file. Then, that can then be imported into a Power BI report.
How To Import a Custom Visual from a File

.pbiviz file that you want to import. Select the Open option. The custom visual’s icon shall be added to the bottom of your visualizations pane and be available for use in your report.
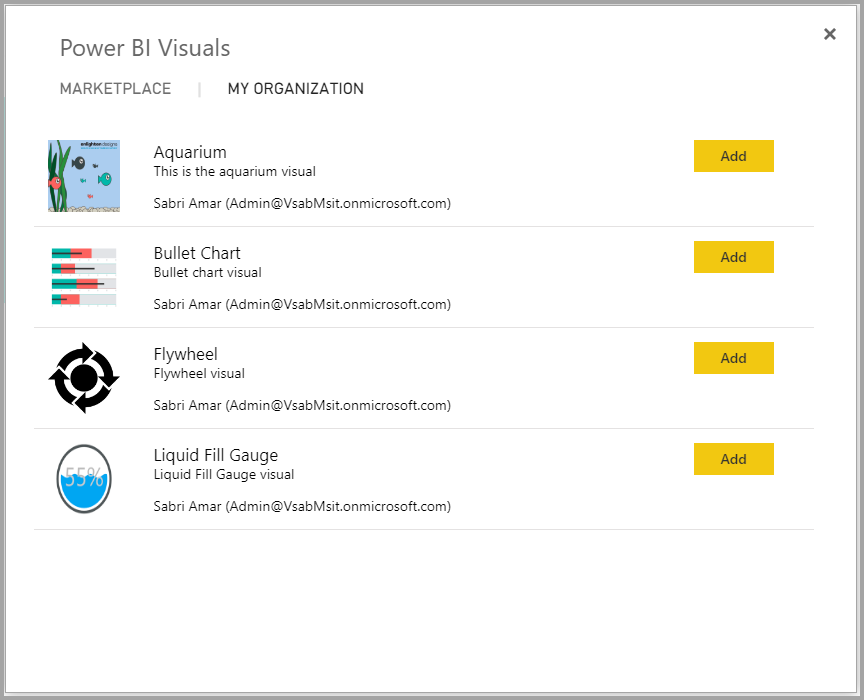
Power BI administrators and other such professionals approve and deploy Power BI visuals into their organization. The report authors can easily discover, update, and use these visualizations and admins can easily manage the same.
Power BI visuals are designed to be interactive and dynamic, but users often face challenges when visuals do not resize properly across different screen resolutions, monitors, or mobile devices. This can lead to cut-off visuals, misaligned elements, or overlapping content, affecting report usability.

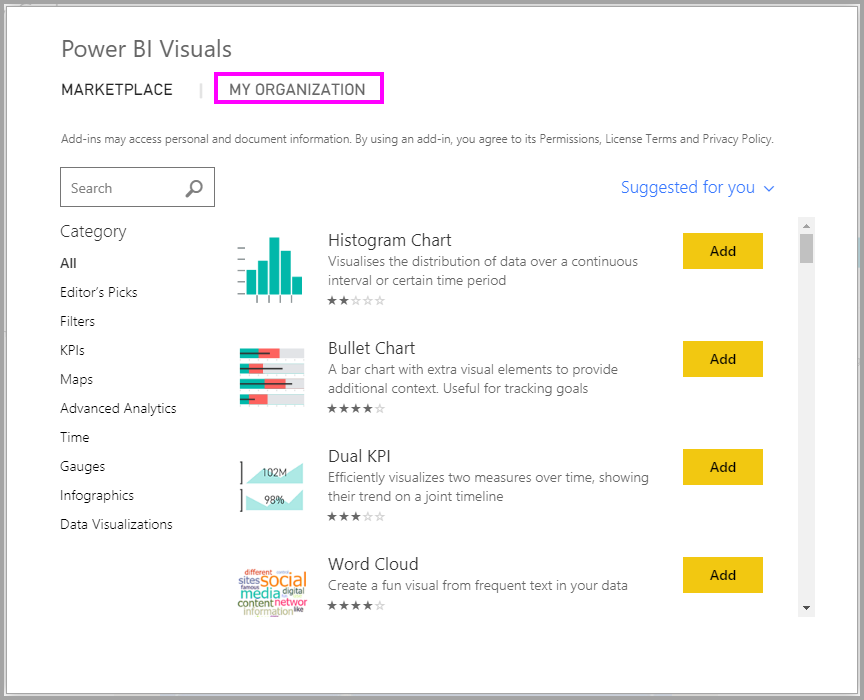
Members of the community and Microsoft, both, have contributed their Power BI visuals for the interest of the public on the AppSource marketplace. This is a marketplace where you can find apps, add-ins, and extensions for your Microsoft software and add them to your Power BI reports. These visuals have been tested and approved for efficiency and quality.
You have two options for downloading and importing Power BI visuals: from within Power BI and from the AppSource website.


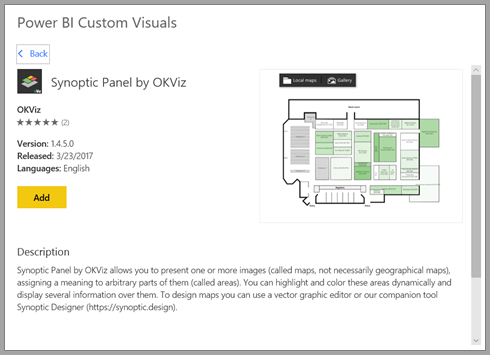
Master the art of Query Folding in Power BI to enhance data processing and report efficiency. Learn how to streamline your queries for faster, more responsive dashboards.
When working with Power BI visuals, handling multi-level filters in a DAX formula is crucial to ensure accurate data aggregation. Multi-level filtering typically arises when dealing with hierarchical data, slicers, or complex conditional filters.
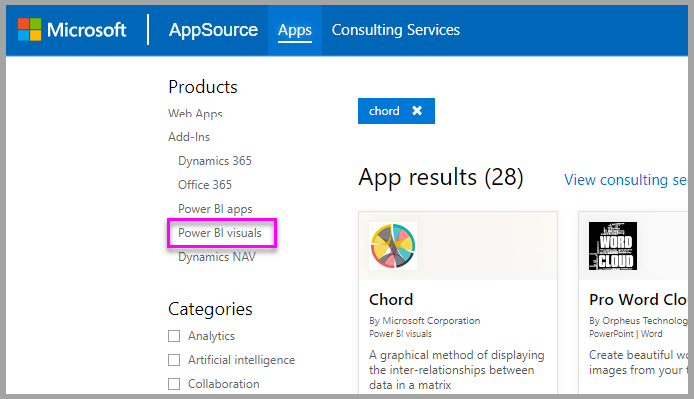 The AppSource displays a tile for each custom visual. Each tile has a custom visual snapshot with a brief description and a download link of the same.
Go ahead and select the link to download the custom visual. 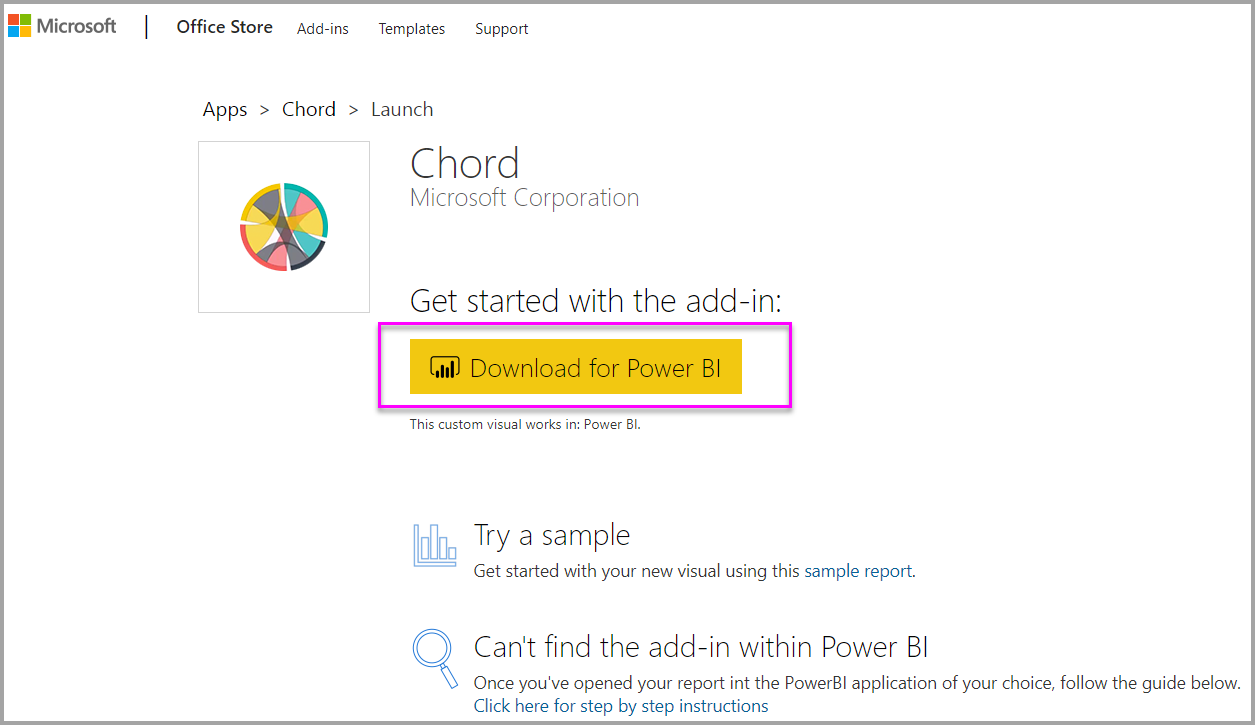
Import the .pbiviz file into your Power BI report.
You can refer to this video curated by our expert for a more in-depth explanation.
Custom visuals are added to specific reports when imported. If you would wish to use the viz in another report, you need to import it there as well. When a report which has a custom visual is saved using the Save As option. A copy of the custom visual is saved with the new report.
If you don’t see a Visualization Pane in your report, it means you don’t have report edit permissions. You can only add BI visuals to those reports which you can edit and not the ones that have only been shared with you.
Transform your data analysis with the drill down in Power BI. Learn how to navigate through layers of data to uncover hidden trends and insights in your Power BI reports.
With this, we come to the end of this article. I hope you got an idea of visuals in Power BI. Learn How to replace Blank with 0 in Power BI Visual in Edureka Community.
If you wish to learn Power BI and build a career in data visualization or BI, then check out our Power BI Certification Training which comes with instructor-led live training and real-life project experience. This training will help you understand Power BI in-depth and help you achieve mastery over the subject. Also, Take your career to the next level by mastering the skills required for business analysis. Enroll in our Business Analyst Course today and take the first step towards a fulfilling and lucrative career.
Got a question for us? Please mention it in the comments section and we will get back to you.
 Thank you for registering Join Edureka Meetup community for 100+ Free Webinars each month JOIN MEETUP GROUP
edureka.co