


Power BI Certification Training Course: PwC A ...
- 101k Enrolled Learners
- Weekend/Weekday
- Live Class
(33100)


 Copy Link!
Businesses are using data analytics more and more to promote growth and guide decision-making in today’s data-driven environment. Effective data modeling is a crucial part of this analytics approach, especially when using strong tools like Power BI. The growth projections for the data analytics market highlights the importance of Power BI data modeling. It is projected to grow from USD 51.55 billion in 2023 to USD 279.31 billion by 2030, exhibiting a CAGR of 27.3% during 2023-2030. This significant growth underscores the increasing reliance on data-driven decision-making and the critical role that effective Power BI data modeling plays in this process.
This article will take you through several key topics: Star Schemas, why Star Schemas is a data modeling best practice, the benefits of data modeling, Power BI data model examples, how data modeling concepts impact analytics, and how to choose a Power BI data modeling tool.
The process of describing and assessing every kind of data a company generates and gathers, along with the connections between them, is known as data modeling. The concepts of data modeling enable the creation of visual representations of data as it is collected, stored, and utilized in your company through text, symbols, and diagrams. Data modeling becomes an exercise in comprehending and defining your data requirements as your firm decides how and when to use data.
Data modeling in Power BI encompasses the final product and the steps taken to get there. Organizations can significantly benefit by devoting time and resources to data modeling, which supports data exploration, enhances performance, accuracy, future maintainability, and teamwork.
Creating a structured and organized data model allows users to easily navigate different data sets, uncover insights, and identify trends. This structured approach simplifies complex data relationships, making it easier for users to understand and explore the data effectively.
The performance of your Power BI reports is heavily influenced by how well your data is modeled. A well-designed data model can significantly enhance query performance, leading to faster retrieval and more responsive reports. Data modeling in Power BI ensures that your Power BI solution can efficiently handle large volumes of data.
Data modeling for Power BI is essential for creating reliable reports. By defining transparent relationships and data hierarchies, data models help ensure the information presented in reports is correct and consistent. This reduces the risk of errors and ensures that decision-makers can trust the insights derived from their Power BI reports.
When data sources, business rules, or reporting requirements change, having a clear and organized data model makes it easier to implement these changes. This reduces the maintenance burden on IT teams and ensures that your Power BI reports remain up-to-date and relevant.
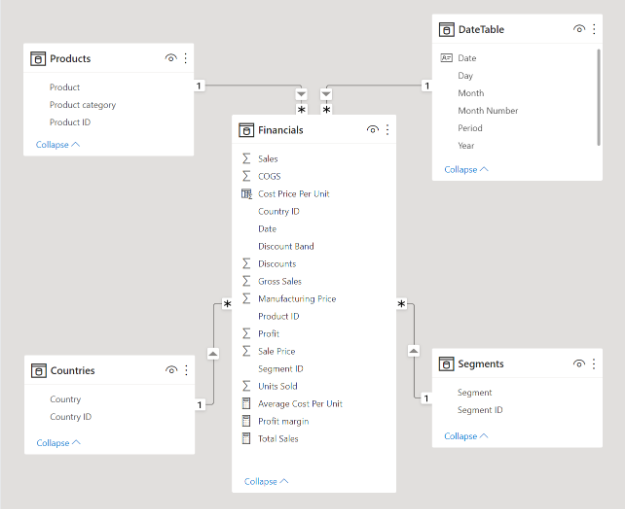
Star schema is a data model in which a fact table is located in the middle, and other sub-tables are distributed in various directions, making them look like a star. One fact table should be deemed optimal for a data model. However, more than one fact table should be utilized when creating models in Power BI.
The attribute table or fact table in a star schema stores atomic, measurable, and summarizable measures and one or more keys that point to the dimensions. These keys are used to make appropriate links between different tables to ascertain close relations.
To support both summary and detailed-level reporting without duplicating tables, structure your model using a Star Schema with separate fact tables for detailed data and dimension tables for summary data. You can create aggregated tables using DAX to summarize data at higher levels and avoid duplicating data. Additionally, consider using Row-Level Security (RLS) to restrict access to sensitive detailed data based on user roles.
Ideally, fact tables should be kept aligned with the least number of columns to manage the code density. For example, any descriptive data that might be included in a cube, such as Product Name or Product Category, should be moved to dimensions. Normalization is a process that is used to ensure that the data model is not cluttered with repetitive values and is exceptionally tidy in its presentation.
 Role of Dimension Tables
Keys of dimension tables relate to the concept of business dimensions where attributes associated with a particular aspect of the dataset are given as separate tables to avoid the creation of large tables that may be difficult to manage. These tables should have distinct values as their features, and the different columns will be used for Report Level Filters or Groups in Power BI reports.
More specifically, the star schema can be extended into the snowflake schema if the dimension tables need to be divided into subgroups. For example, some cases involve a Product table with fields like Product ID, Product Name, and Product Category. In a snowflake schema, the second level would give rise to a second table: Product Category with fields Product Category ID and Product Category.
Snowflake can be advantageous in providing a more granular classification; however, it contributes extra complications to the general framework. It is also important not to include additional tables as it may slow the work. Creating relations may lead to a breach of the complexity of relations, thus affecting the whole model.
Identifying, connecting, and analyzing data modeling for Power BI offers several benefits:
Data modeling in Power BI is an essential activity in a data integration project, and getting acquainted with the main concepts of data modeling is necessary. Now, let’s focus on the Data modeling in Power BI with examples.
The conceptual data model represents ‘what’ the business is about and the nature of data. Organized to incorporate business ideas, this conceptual data model is developed with your business stakeholders and data engineers or architects. For instance, you may have customer, employee, and product data; all of these data structure buckets are called entities, and each has relationships with other entities. In your CD/ER model, the entities and the entity relationships are determined.
A conceptual data model illustrates abstract concepts of data within each entity and the relations of each entity. A logical data model takes it a step further by defining specific characteristics of data within each entity and the ties of the traits. For example, Customer A is buying Product B from Sales Associate C. Data engineers, architects, and business analysts define this as the technical model of rules and data structures for making decisions regarding a physical model of your data and business.
A physical data model is your specific manifestation of a logical data model developed by DBA and other computer science experts to create data model in Power BI. It is designed for a particular database tool or data storage technology. It also has data connectors to get data around your enterprise systems to the consumers as and when required.
Data modeling concepts profoundly impact analytics by providing a structured approach to organizing and interpreting data, which is essential for practical analysis. By creating a blueprint for the database, data modeling ensures that data is stored in a manner conducive to study, maintaining data integrity through transparent relationships and hierarchies. This structure enhances the efficiency of data retrieval and manipulation, leading to faster and more effective analytical processes.
Data models support predictive analytics by offering a framework to forecast future trends based on historical data. They also facilitate informed decision-making by organizing data in an easily understandable way and drive innovation by uncovering new insights and business opportunities. Data modeling is about making data work for you, enabling more profound insights and strategic analytics decision-making.
Enhance Your Data Skills with Our Power BI Course Today and Master Data Modeling for Deep Insights!
BI tools provide you with all the data modeling tools you require, alongside the software products and services you opt for to build your physical form. It is valuable to consider the data modeling best practices outlined below:
When choosing a data modeling tool, you should focus on its easy-to-use interface. It will come in handy for sharing insights, creating data-driven stories with your team members, or building data dashboards for analyzing patterns.
Another crucial consideration is performance—the speed and efficiency of supporting users’ analyses and the tasks that must continue while those analyses are conducted. Even the most effectively planned data model is not the best if it cannot perform well under business growth, increased data retrieval, and more extensive analysis demands.
Suppose every turn or bend in your business model entails a cumbersome choreography of changes in your data model and the associated analytics deployment. In that case, your business will not get the best out of that model. Select a tool that makes it easy to update your data, allowing your company flexibility while ensuring you have the latest data.
The various government regulations currently in place demand that you protect customer data. Moreover, the success of your business calls for protecting all your data since they are valuable assets. Ensure the data modeling tools you select incorporate a robust security system that addresses access control, ensuring only authorized individuals can access the data while keeping unauthorized persons out.
Data modeling, data science, and analytics all go hand-in-hand—you need a quality data model to get the most impactful data analytics for practical business intelligence that’ll inform your future decision-making. Creating a data model involves forcing each business unit to consider how they contribute to their holistic organizational goals. Plus, a solid data model means optimized analytics performance, no matter how large and complex your data estate is, or will become. In Power BI, data modeling is not just about structuring your data but also about enhancing your ability to derive meaningful insights, ensuring that your analytics are accurate, and making future maintenance of your reports simpler and more efficient.
1.Is this data modeling tool intuitive?
Many data modeling tools are designed to be intuitive, with features like drag-and-drop capabilities and visual representations that simplify the modeling process.
The performance of data modeling tools can vary, but top tools are generally efficient, supporting complex flows and offering strong data protection.
Regular maintenance is often required to ensure the data model stays current and accurate, adapting to changing business needs.
Data security is a priority for data modeling tools, with many offering robust security features to protect your data.
Data models are commonly used in BI for organizing information, ensuring data accuracy, enhancing decision-making, and identifying business problems.
Read More Related Queries


 Thank you for registering Join Edureka Meetup community for 100+ Free Webinars each month JOIN MEETUP GROUP


