Microsoft Azure Data Engineering Training Cou ...
- 15k Enrolled Learners
- Weekend
- Live Class
Chew on this. The total IT budget for the Rio De Janeiro Oympics 2016 is $1.5 billion and all of the games data is stored on the cloud. Back in 2012, the London Olympics became the first Big Data driven sporting event where 60 GB of data was transferred and 30,000 tweets were sent every second. 15 terabytes of data was generated every day by sports enthusiasts around the world. This year, these numbers are set to become a joke.
The Rio Olympics 2016 is fundamentally using the power of Big Data in three distinct ways:
Even before the games begin in Rio, Big Data is being used to predict winners. For instance, Gracenote, a global provider of entertainment data, is leveraging its Big Data and predictive analytics expertise to provide detailed predictions that reveal which countries will top the medal tally, specific athletes who will emerge winners at the Olympics 2016, as well as an overall medals tally. According to Gracenote, it has used performance data from thousands of events in addition to data from an extensive Olympics database dating back to 100 years, to create what it calls a ‘Virtual Medal Table’ (VMT), which is essentially a dashboard which presents these results in an intuitive manner. Broadcasters, sports websites and mobile providers will use data from this dashboard and personalize results for audiences from their respective countries. Here’s a sample of Gracenote’s Rio VMT for 2016:
It is not just third-party providers who are using Big Data at the Rio Olympics 2016. The coaches of various countries are enhancing their training programs by using analytics data of their players as well as data available in the public domain. For team sports, analysis of historical player performance data, performance trends against specific competition, and fitness statistics are sourced through data analytics. For non-team sports, predictive analytics is used to identify who a particular athlete is pitted against, his/her strengths and weaknesses, insight into past strategies, and most importantly, to enhance fitness based on trends. Simply put, Big Data Analytics connects an athlete to his/her strengths and provides a mirror to his/her sporting abilities.
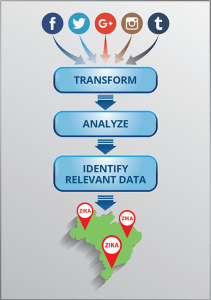
No entry for Zika at Rio Olympics 2016! Thousands of Brazilian officers and dozens of non-profit organizations are involved with the Rio Olympics 2016, to ensure a disease-free games season. With looming threats of the Zika virus, as well as Dengue and Chikungunya, officials are leveraging social data to combat viruses. IBM is helping the organizing committee by leveraging Big Data Analytics to crowdsource data from social media. The company is organizing and arranging huge amounts of online data, including the frequency and distribution of social media comments and conversations about Zika and other viruses.
IBM is also using its cloud computing backbone to analyze Portuguese-language Twitter postings about the virus. Additionally, it is also analyzing GPS-enabled data around the prevalence of the Aedes aegypti mosquito, which spreads the Zika virus. All of this data is synced up with other auxiliary data like weather, location of airports around Brazil where potential Zika infected people are quarantined. Other high-risk areas are monitored in real-time to identify outbreaks, earmark high-risk areas and prevent probable infection to athletes as well as the global audience that descends on Rio.
In order to better understand the process that can be followed for predictive analysis of Big Data in scenarios like these, let’s consider the nature of data that needs to be processed in order to create performance leader boards. Let’s understand this step-by-step:
Step 1: The first step is to identify the key metrics on which the result would depend. The available data for 100 odd years can be segregated into Country, Sport, Result, Name of the athlete, age of the athlete, previous performance records, among others.
Step 2: Once the metrics is identified, the data can be divided into two sub data-sets, say a Training data-set and a Test data-set.
Step 3: Data from the Training data-set can then be used to create Models. The Test data-set, on the other hand, contains all of the historical data including definite results.
Step 4: Data from the Test data-set is fed into the Model and mapped for results. This way, we can get data that can predict results based on historical data.
However, for crowdsourcing social data for preventing disease outbreaks, a relatively simpler process can be used:

Data around social media interactions from different social channels can be streamed live, probably using Spark Streaming, into a Hadoop Distributed File System (HDFS). Once all the different data is transformed into a standardized format, this data can be analyzed for co-ordinates such as location, time of the data etc. Based on an exhaustive set of keywords, relevant data can be retrieved and real-time alerts can be created for efficient disease control.
These are just some of the ways in which the Big Data is playing its part in the biggest sporting event of the year. Do you have any ideas of how Big Data can be used in sporting events or for better public health? Feel free to write your comments below.
Want to learn Big Data from industry experts? Edureka has created a top-class course on Big Data & Hadoop that helps you learn more about Hadoop clusters, HDFS, HBase and much more. Click here if you wish to know more.
Related Posts:
 Thank you for registering Join Edureka Meetup community for 100+ Free Webinars each month JOIN MEETUP GROUP
edureka.co