PySpark Certification Training Course
- 12k Enrolled Learners
- Weekend/Weekday
- Live Class
One of the biggest reasons why the popularity of Hadoop skyrocketed in recent times is the fact that features like Pig and Hive run on top of it allowing non-programmers with functionality that was previously exclusive to Java programmers. These features were a consequence of the growing demand for Hadoop professionals. Other features that are used by Hadoop professionals from non-Java backgrounds are Flume, Sqoop, HBase and Oozie.
To understand why you do not need Java to learn Hadoop, do check out this blog.
Let’s understand how these features work.

We all know that programming knowledge is a necessity for writing MapReduce codes. But what if I have a tool that can do the coding if I would just provide the details? That is where Pig exhibits its muscle power. Pig uses a platform called Pig Latin that abstracts the programming from the Java MapReduce idiom into a notation which makes MapReduce programming high level, similar to that of SQL for RDBMS systems. The codes written in Pig Latin MapReduce automatically get converted to equivalent MapReduce functions. Isn’t that awesome? Another Mind-Blowing fact is that only 10 Lines of Pig is needed to replace 200 Lines of Java.
10 lines of Pig = 200 lines of Java
This not only means that non-Java professionals use Hadoop but also testifies the underlining fact that Pig is used by an equal number of technical developers.
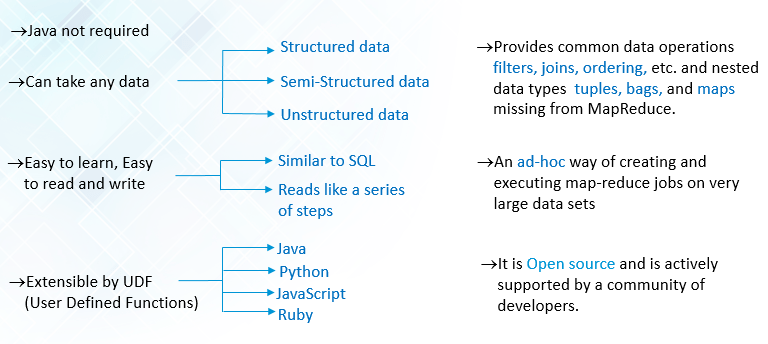
Additionally, if you want to write your own MapReduce code, you can do that in any of the languages like Perl, Python, Ruby or C. Some basic operations that we can perform on any Dataset using Pig are Group, Join, Filter and Sort. These operations can be performed on structured, un-structured and also semi-structured data. They provide an ad-hoc way for creating and executing MapReduce jobs on very large data sets.
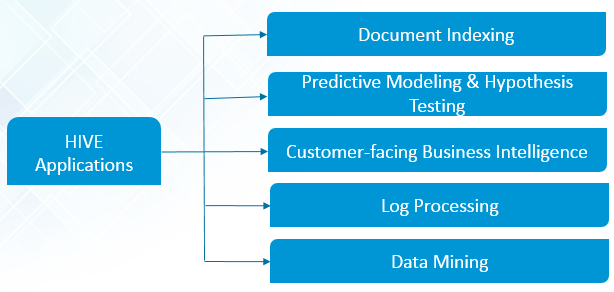
Next up, let’s understand Hive. It is an open source, peta-byte scale data warehousing framework based on Hadoop for data summarization, query and analysis. Hive provides an SQL-like interface for Hadoop. You can use Hive to read and write files on Hadoop and run your reports from a BI tool. Some typical functionality of Hadoop are:
Let me show you a demo using Pig on Clickstream data set
We will use this Clickstream data and perform Transformations, Joins and Groupings.
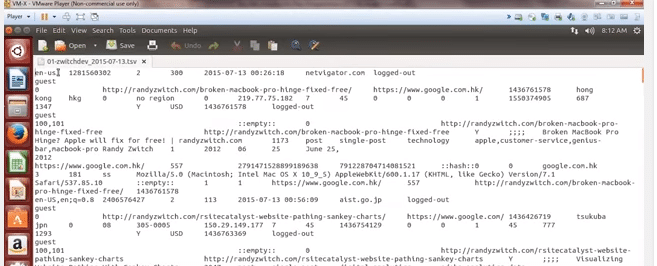
ClickStream is a series of mouse clicks made by a user while accessing the Internet especially as monitored to assess a person’s interests for marketing purposes. It is mainly used by online retail websites like Flipkart and Amazon who track your activities to generate recommendations. The Clickstream data set that we have made use of has the following fields:
1. Type of language supported by the web application
2. Browser type
3. Connection type
4. Country ID
5. Time Stamp
6. URL
7. User status
8. Type of User

It will look like this with the appropriate fields.

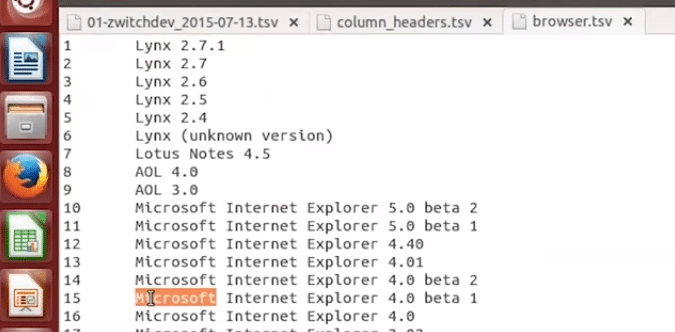
Below is the list of browser types that have been used by various people when surfing on a particular website. Among the list are browsers like Internet Explorer, Google Chrome, Lynx and so on.
Internet connection type can be Lan/ Modem/Wifi. See the image below for the complete list:
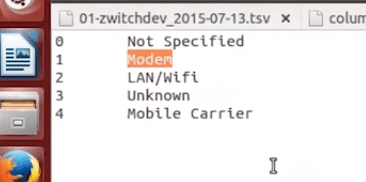
In the next image, you will find the list of countries from where the website has attracted audience along with their IDs.
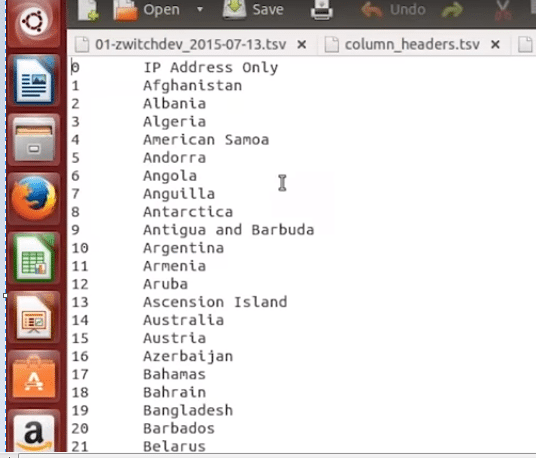
Once we have gathered all the data sets, we have to launch Pig’s Grunt shell, which is launched in order to run the Pig commands.
The first thing we have to do on launching Grunt shell Is to load the Clickstream data into Pig’s relation. A relation is nothing but a table. Below is the command that we use to load a file residing in HDFS onto Pig’s relation.

We can verify the schema of the relation by the command describe click_stream.

We now need to add the reference files which will contain details about the list of countries with their IDs and the different browser types along with their IDs.

We now have two reference files, but they need to be connected to form a relation.
We run a connection_ref command to indicate the type of connection.
Now that we have a working connection and an established relation, we will show you how we can Transform that data.
For each record in Clickstream, we will generate a new record in a different format, i.e the transformed data. The new format will include fields like TimeStamp, Browser type, Country IDs and a few more.

We can perform a Filter operation to trim down the Big Data. The different types of users are Administrators, Guests or Bots. In our demo, I have filtered the list for the Guests.
 If you remember, the Country ID is present in the Clickstream and we loaded a country_ref file containing the names of the countries along with its IDs. We can thus perform a Join operation between the two files and merge the data to derive insights.

If we have joined the data, then we can find out the different countries from where the users are by Grouping. Once we have this data, we can perform a Count operation to identify the number of users from a particular country.

It is no rocket science to derive insights from Big Data. These are just some of the many features that I have implemented and with tools like Hive, Hbase, Oozie, Sqoop and Flume there is a treasure of data yet to be explored. So those of you who are holding yourselves back from learning Hadoop, it’s time to change.
Got a question for us? Please mention them in the comments section and we will get back to you.
Related Posts:
Get Started with Big Data and Hadoop
4 Ways to Use R and Hadoop Together
Everything About Cloudera Certified Developer for Apache Hadoop
 Thank you for registering Join Edureka Meetup community for 100+ Free Webinars each month JOIN MEETUP GROUP
edureka.co